
Tableau Deep Dives are a loose collection of mini-series designed to give you an in-depth look into various features of Tableau Software.
In all of our previous examples of this Deep Dive, we’ve been adding our new sets to the Filters card. That’s filtering our view (as well as limiting the membership available in our filter control as we did in part two). What happens if we drag our set directly onto our Rows or Columns? What else is possible by using our set on the Marks card?
Let’s find out!
Show IN/OUT of Set
I’ve created a computed set for the Top 100 Most Profitable Products using the Sample – Superstore data source that comes ready to use with Tableau Desktop. Remember, I’ll use the Top tab in my Create Set window (see part three). Here’s what it looks like when I drag that set onto Rows and Sales to Columns:
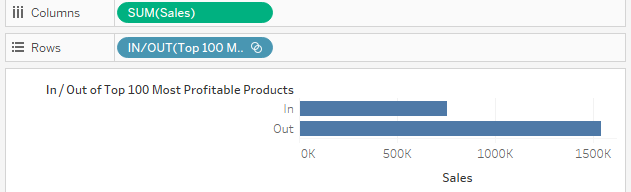
Notice how my new set is treated on the Rows shelf. It is now showing IN/OUT in the set capsule. The set reflects a Boolean relationship. The IN is everything that is inside of my set (i.e. the top 100 most profitable products) and the OUT is everything that does not qualify for my set.
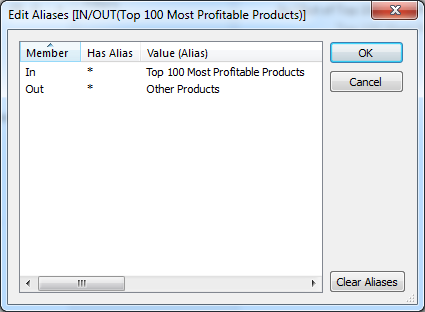
We can edit the aliases of my set, IN and OUT, to make them more relevant to our view. Let’s change them by right-clicking on the set on the rows shelf and selecting Edit Aliases:
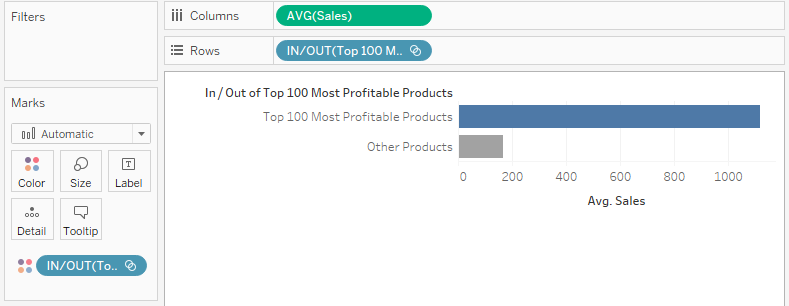
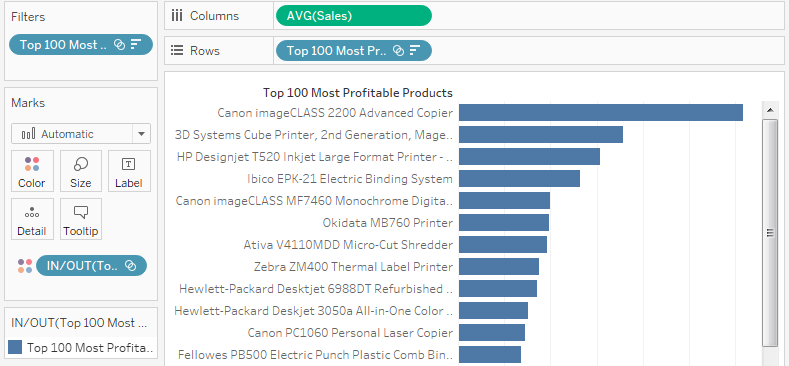
In addition, we’ll drag another instance of our set onto Color and change Sales’ aggregation from sum to average. That gives us the following view which really illustrates the differences between the members of the set. It makes sense that our most profitable products are also driving a lot of sales:
Show Members IN Set
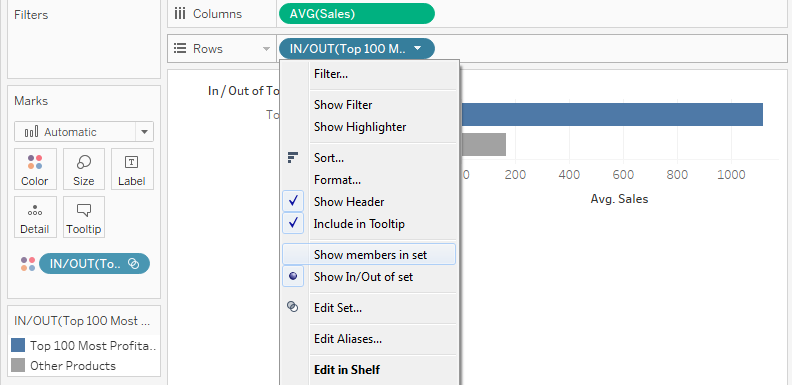
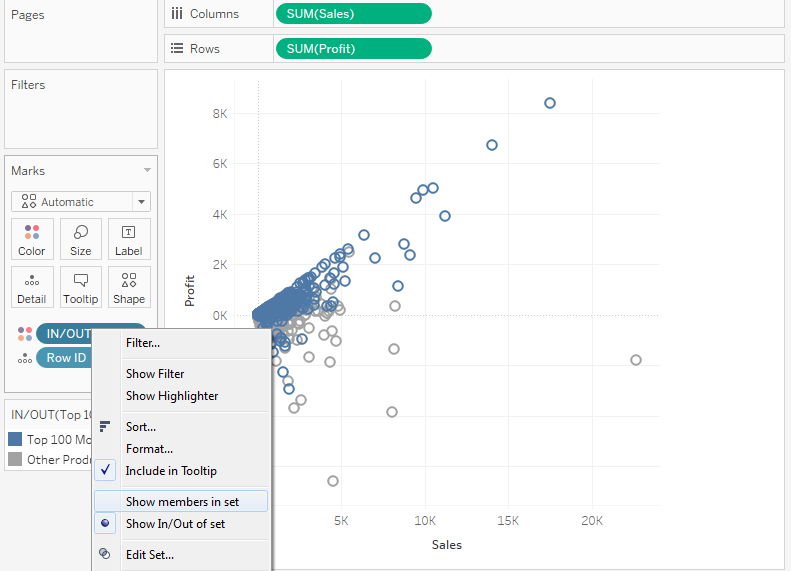
I can turn off the IN/OUT setting to display the most profitable products in my set by right-clicking on the set capsule and selecting Show Members in Set:
This option excludes the OUT membership and instead shows each member of the IN set. Tableau will automatically add the set to the Filter card and select the IN option. This makes sense as we are filtering the OUT membership from our view:
Let’s look how toggling the IN/OUT and IN-only options on the set will appear on a scatter plot. Here’s a sample scatterplot with the set showing both IN/OUT:
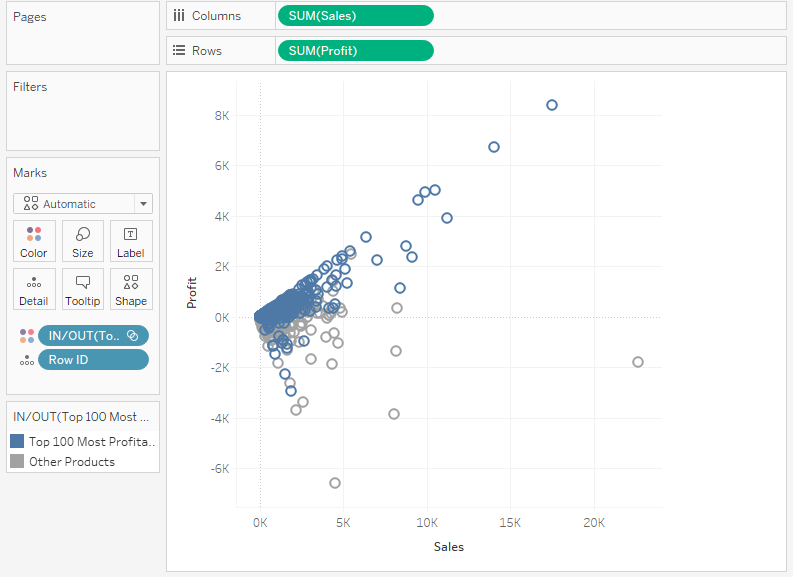
Blue marks are the IN membership and grey marks are the OUT membership. Let’s toggle the IN/OUT option on the set, which is on the Color button:
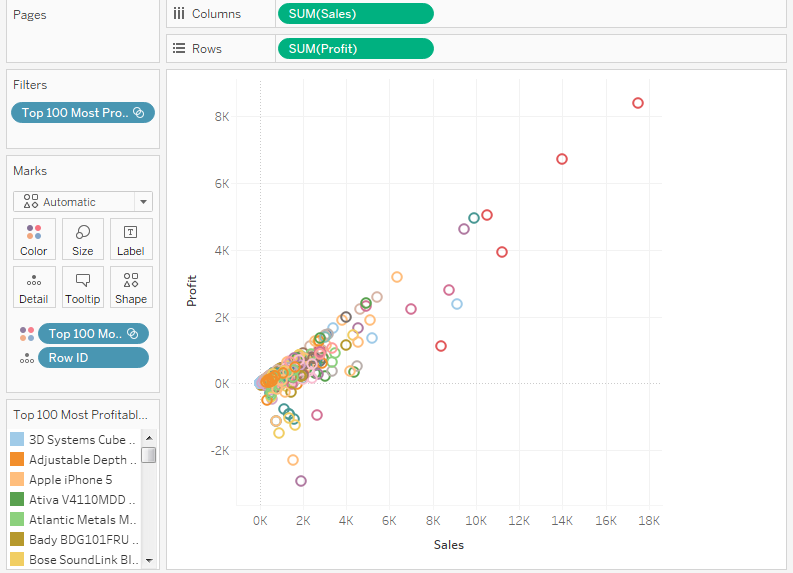
It filters the OUT membership and then colors the IN membership uniquely. Again, notice the set is added automatically to the Filter card. This switch gives us this result:
IN/OUT on the Row Level
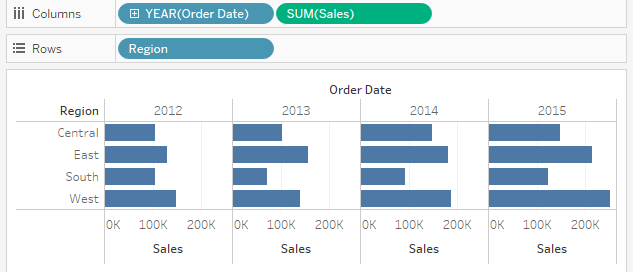
Let’s consider a use case. We’ll build the following view with sum of Sales by discrete years for Order Date and Market, like so:
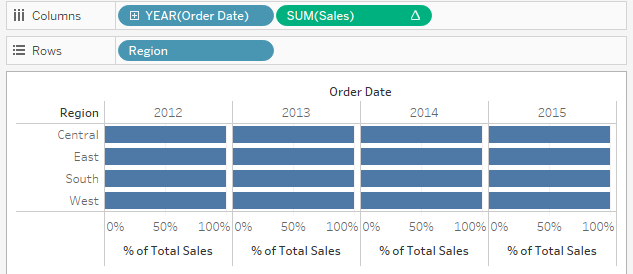
I want to show the breakdown by each region for each year of the percent of total of sales, comparing the top 100 most profitable products against the rest of the product list. First, I need to add a Quick Table Calculation > Percent of Total. I want to make sure that my scope is Cell:
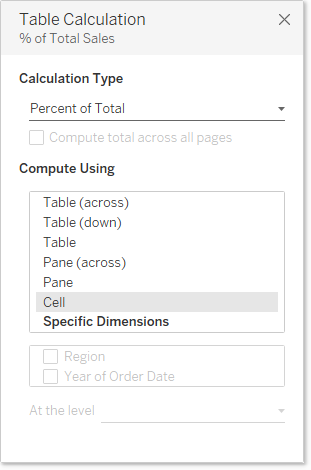
Here’s how my view looks for now:
Now let’s add our set to the Color button to break down each cell into members IN the set and those that are OUT of the set as a percentage of Sales for each market by year:
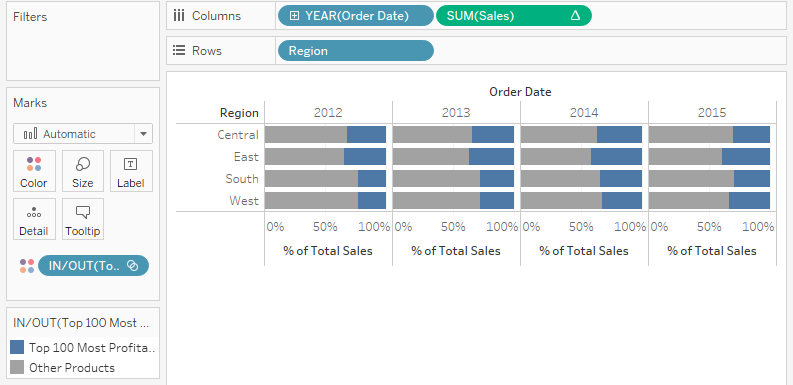
Eureka! Now we can see how much our top profit products contribute to the total sales for each region over time. In the viz above, we can see the East has less reliance on our top products than other regions. As a result, the distribution of our product line is strongest in the Eastern region.
What’s Next?
In our next article in the Sets Deep Dive, we’ll examine Combined Sets. Remember, share any thoughts or feedback in the comments section provided below. I look forward to your feedback!