Questions from Tableau Training: Labeling the Top N

Data

Questions from Tableau Training: Labeling the Top N

Our Certified Tableau Trainers are asked a myriad of questions each day. In this series, they share some answers.

Here’s a question I got from a student named Summer in a DII: Intermediate course in Hong Kong:

“I want to show all of the cities in the United Kingdom for a particular measure but only show city name labels for the top five.”

Awesome question! Let’s get to solving.

We’ll use the Global Superstore data source for our sample data, which is a publicly offered from Tableau and can be downloaded here.

Preparing Our View

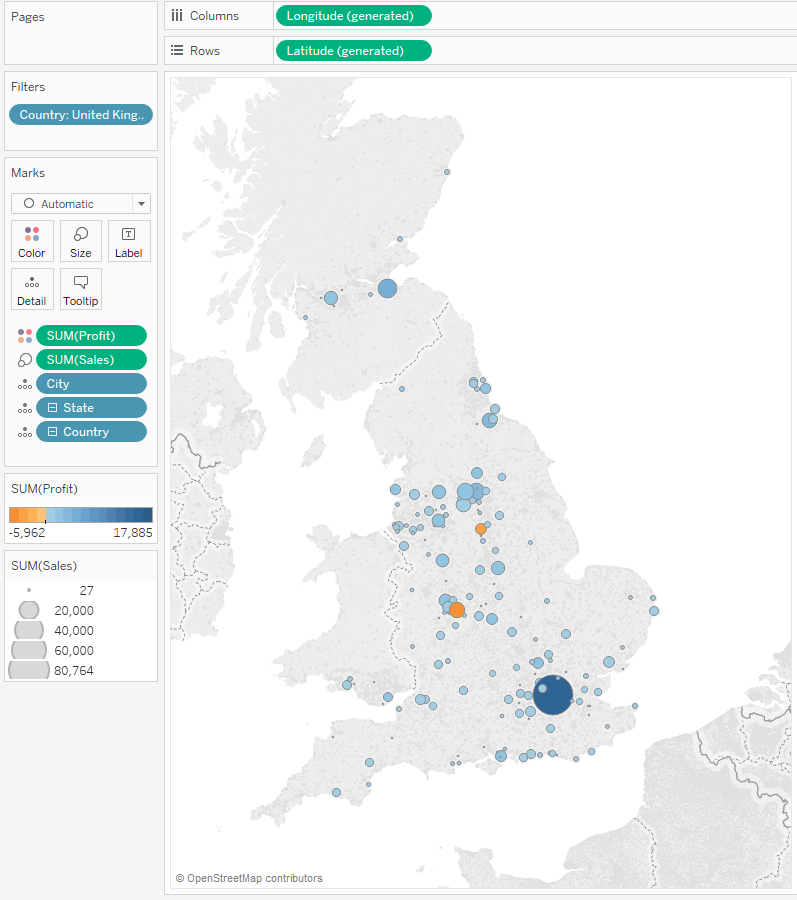
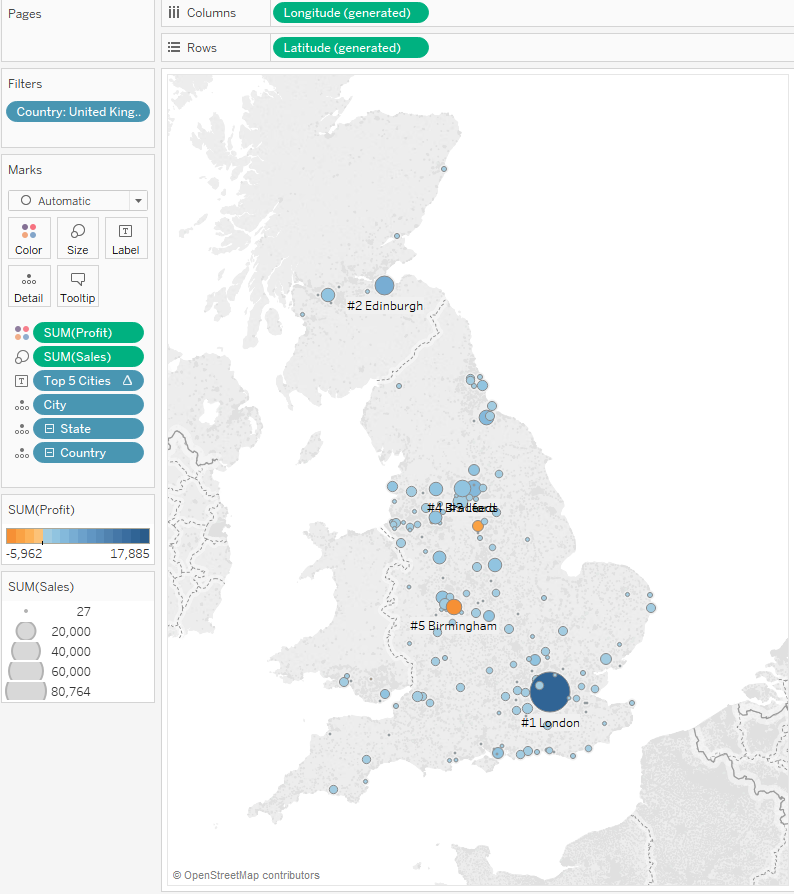
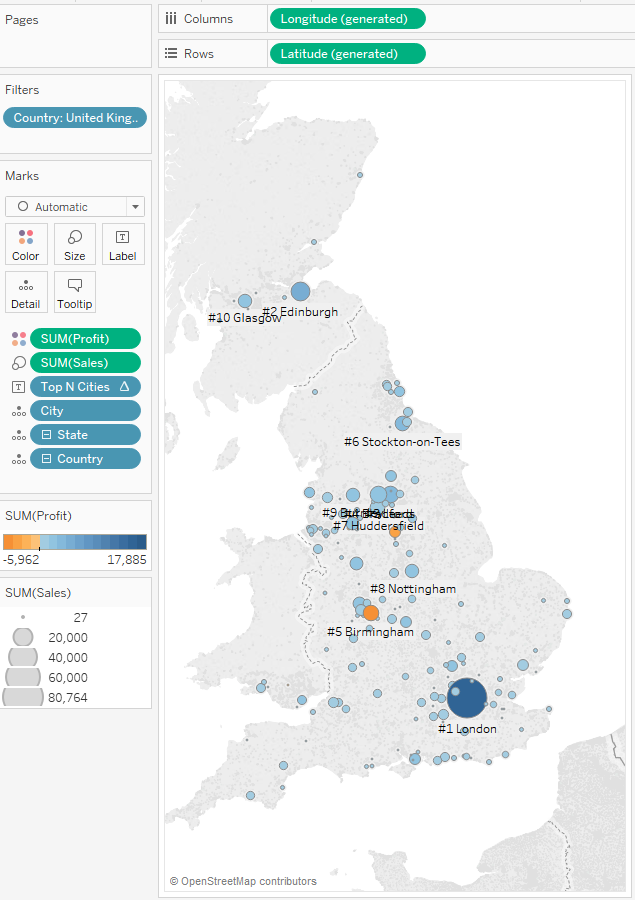
I’m going to start with a symbol map of the United Kingdom with my level of detail down to City. I’ll color the circles using Profit and size them using Sales. Finally, I’ll add some stylistic touches using my map layers.

This will be our starting visualization:

Starting viz

I want to label the top whatever cities on the basis of sales. If I do a top N filter on cities, it will filter all of the data for the cities outside of the top N. If I create a set, it will also filter. So, how do I do this?

Table Calcs to the Rescue!

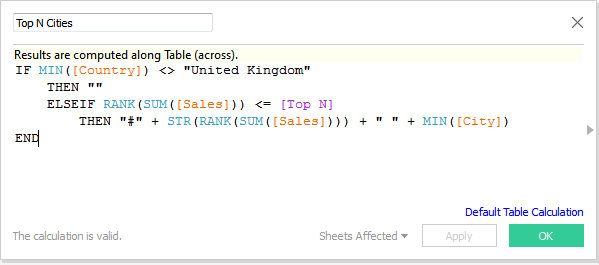
We are going to use a calculated field with a customized table calc inside of it. We’ll start with a logical test for whether the city falls within the United Kingdom. For those that do, we’ll use Rank to determine the order of cities by Sum of Sales, and then we’ll create a special label to include the rank.

Here’s what our calculated field looks like:

Top 5 Cities calculation

Remember, we’re adding aggregation to Country and to City in our calculated field so that the aggregation level matches our measures. You cannot have aggregated and non-aggregated fields in the same calculation.

Now let’s drag our calculation onto the Label button. This is what we get:

Tableau viz with calculation

Houston, we have a problem.

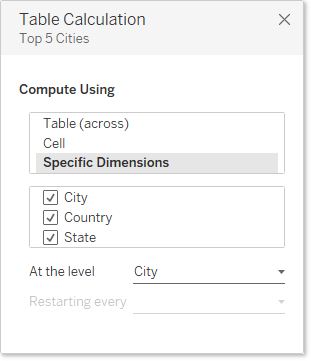
The reason that we have a bunch of #1’s and not a top five is because the scope in our table calculation is defaulting to Table (Across). That doesn’t help us here. We’ll need to edit our table calculation in our Top 5 Cities calculated field. Tableau Desktop 10 has a new modal table calculation that allows us to see our scope and direction live as we make changes. Pretty cool stuff, eh?

Rather than Table (Across), we’ll need to choose specific dimensions like this:

Choose specific dimensions

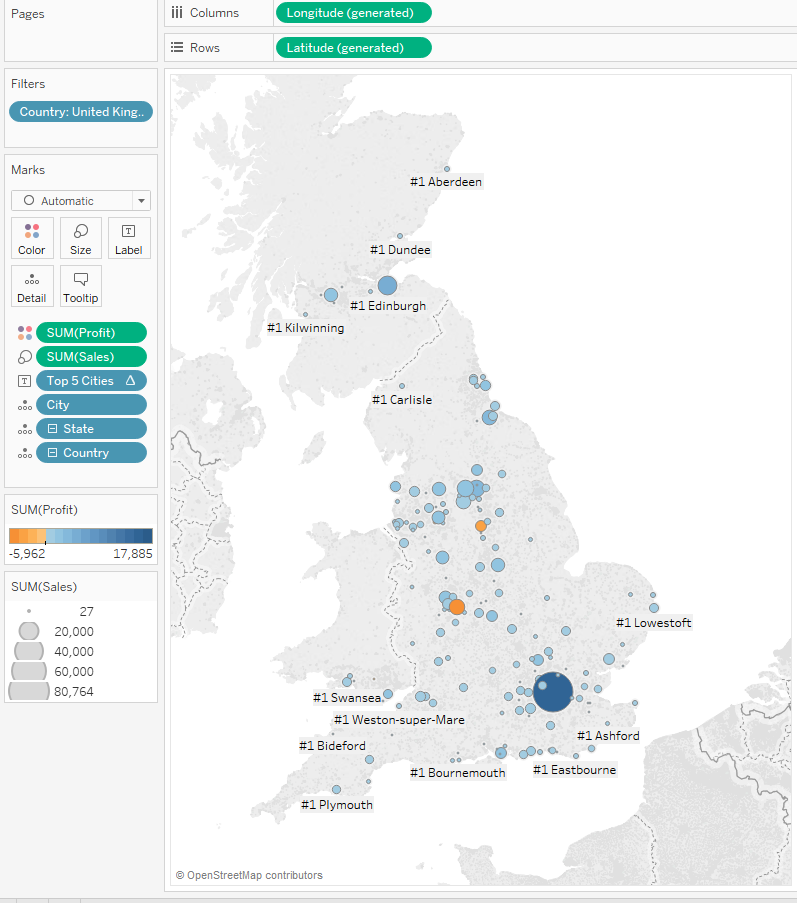
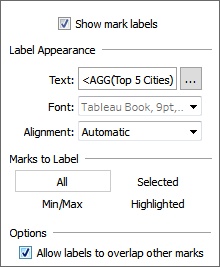
We’ll also have to modify our Labels options to allow our labels to overlap marks, otherwise we won’t get to see all of them:

Labels options

And when we do that, we get the following view:

Tableau viz with new label options

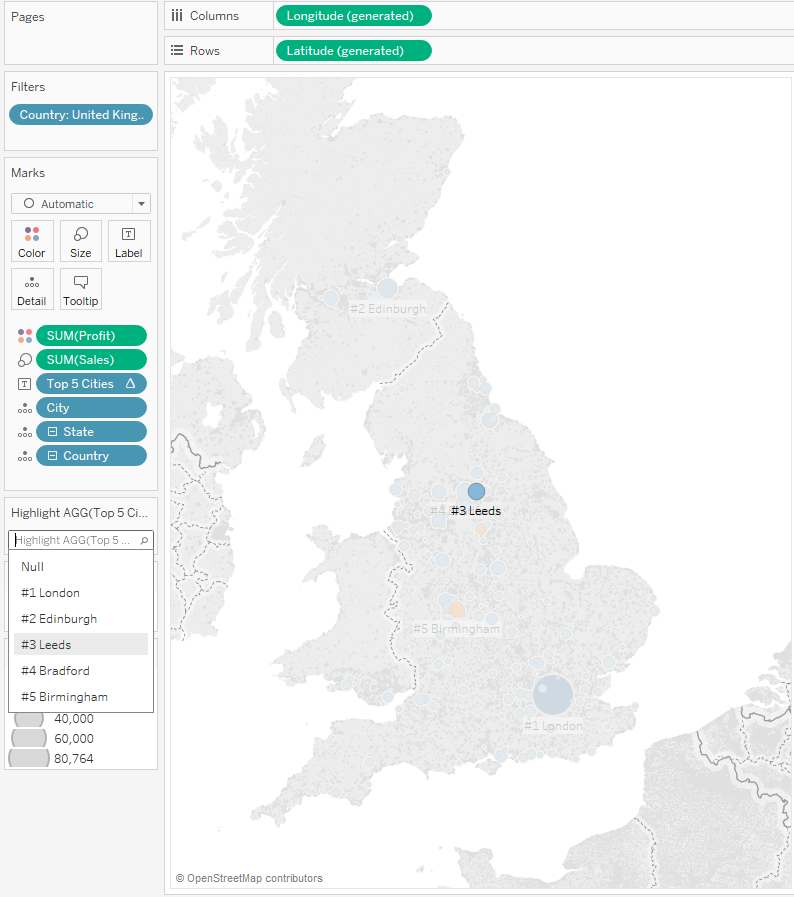
Our third ranked and fourth-ranked cities happen to be right on top of each other, but I promise they are there. To help our report user see them, we can add another new feature from Tableau Desktop 10. Let’s use the Highlighter for our labels. To activate, just right click on the Top 5 Cities field on the Labels button and select Show Highlighter.

We’ll then highlight our #3 city to make it easier to see:

Show Highlighter

Parameterize the Top N

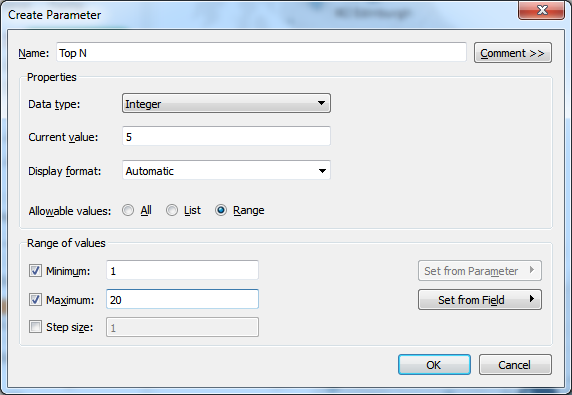
Let’s take our example another step forward and add a parameter so that our user can decide how many top cities they want to include on our map. I’ll start by creating a new parameter. For my seven-part Deep Dive on Parameters, click here.

Here’s our Top N parameter:

Top N Parameter

Now we need to edit our Top 5 Cities calculated field to use our parameter (and we’ll update the name, too):

Top N Cities calculation

And finally, we’ll show our parameter control. This will allow our user the option of changing how many top cities they want to see, such as say the top 10:

Final Tableau viz

Remember, as we add more labels, they can potentially overlap each other and the marks on the map. Use that Highlighter to help isolate the labels and avoid the clutter.

Thanks for a great question, Summer!

Want More Questions from Tableau Training

  1. Questions from Tableau Training: Quick Filter Interaction
  2. Questions from Tableau Training: Labeling with Table Calculations
  3. Questions from Tableau Training: Speeding Up Presentation Views when Using Tableau
  4. Questions from Tableau Training: Dashboard Actions
  5. Questions from Tableau Training: Business Day Calculations
  6. Questions from Tableau Training: Adding Gaps Between Bars
  7. Questions from Tableau Training: When to Pivot Data in Tableau
  8. Questions from Tableau Training: Adding Conditional Formatting
  9. Questions from Tableau Training: Setting Weekday Start
  10. Questions from Tableau Training: How Do ZIP Codes Work in Tableau?
  11. Questions from Tableau Training: The Small Grey Bar Within a Quick Filter
  12. Questions from Tableau Training: Matching Mark Color
  13. Questions from Tableau Training: Showing the Null Indicator
  14. Questions from Tableau Training: Can I Manually Set the Colors of a Stepped Gradient?
  15. Questions from Tableau Training: How Can I Get Box Plot Data into a Crosstab?
  16. Questions from Tableau Training: How Do I Clear a Worksheet? Make a Copy?
  17. Questions from Tableau Training: Opening URL Actions Inside of a Dashboard
  18. Questions from Tableau Training: Can I Move Mark Labels?
  19. Questions from Tableau Training: How Can I Use My Current Report to Create a Viz?
  20. Questions from Tableau Training: Can I Create Text Hyperlinks on a Dashboard?
  21. Questions from Tableau Training: How Can I Transform My Crosstab into a Flat List?
  22. Questions from Tableau Training: Labeling the Top N
  23. Questions from Tableau Training: How Can I Customize Charts with Parameters?
  24. Questions from Tableau Training: Combining Measures into a Single Line
  25. Questions from Tableau Training: How Can I Create Custom Color Palettes?
  26. Questions from Tableau Training: Can a Top N Parameter be Nested Within Other Fields?
  27. Questions from Tableau Training: Conditional Scope on Tableau Calculations
  28. Questions from Tableau Training: Top Ten Plus N
  29. Questions from Tableau Training: Dynamic Label Positioning
  30. Questions from Tableau Training: Using Cross Joins to Solve Active Tickets
  31. Questions from Tableau Training: Top N Highlight Table
  32. Questions from Tableau Training: How to Use Specific Dimensions in Table Calculations
  33. Questions from Tableau Training: Moving Reference Line Labels
  34. Questions from Training: Comparing Metrics for Same Weekday in Previous Year
  35. Questions from Tableau Training: Colouring Specific Columns and Rows in a Crosstab
  36. Questions from Tableau Training: Creating a Custom Legend as a Sheet
  37. Questions from Tableau Training: How Can I Draw a 45-Degree Angle?
  38. Questions from Tableau Training: Down the Aggregation Rabbit Hole
  39. Questions from Tableau Training: Percent Change from Previous Period on a Map
  40. Questions from Tableau Training: Union File Names as Years
  41. Questions from Tableau Training: Conditional Coloring on Sparklines
  42. Questions from Tableau Training: Moving Column Headers to the Top of the View
  43. Questions from Tableau Training: Isolating Rank with Parameters and Calculations

More About the Author

Robert Curtis

Managing Director, APAC
Kickstarting Data Innovation in Healthcare On 13 March 2024, InterWorks was a proud Platinum sponsor of the first ever Data & Analytics in Healthcare conference, hosted by ...
Building Solutions with InterWorks at Corinium’s Data Architecture Conference in Melbourne InterWorks was a proud sponsor of the Data Architecture Conference hosted by Corinium in Melbourne on 21 and 22 June 2023. Hundreds of ...

See more from this author →

InterWorks uses cookies to allow us to better understand how the site is used. By continuing to use this site, you consent to this policy. Review Policy OK

×

Interworks GmbH
Ratinger Straße 9
40213 Düsseldorf
Germany
Geschäftsführer: Mel Stephenson

Kontaktaufnahme: markus@interworks.eu
Telefon: +49 (0)211 5408 5301

Amtsgericht Düsseldorf HRB 79752
UstldNr: DE 313 353 072

×

Love our blog? You should see our emails. Sign up for our newsletter!