
Tableau Deep Dives are a loose collection of mini-series designed to give you an in-depth look into various features of Tableau Software.
We’re continuing our Deep Dive into Dates with further exploration into date specific functions. In this article, we’ll cover DATEADD, DATEDIFF and DATETRUNC. My goal is not only to show you how to use them but to give you some real world examples of when they’d be particularly useful.
We’re going to start with our hypothetical Superstore data source and build a use case that will become more and more complex as we add new functions to our tool belt. Let’s start by adding to a date field.
DATEADD()
DATEADD allows you to add to a date field. If I tell you that I’m going to add +2 to March 2, 2016, your first question should be two of what? Two days? Two months? Two quarters? Tableau allows you specific the unit of measure that you want to add in the function by specifying the date part. Using a negative value allows you to subtract from a date.
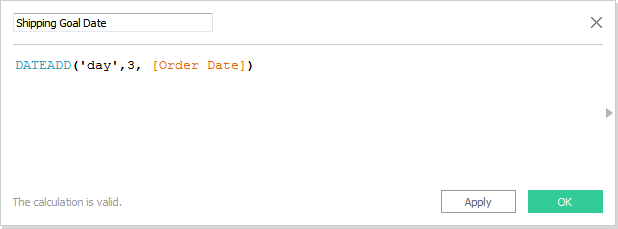
Let’s take our Order Date field from the Superstore.xlsx data source and assume that our business has set a goal to ship all products within three days of the order being placed. We’ll use DATEADD to create the new field:
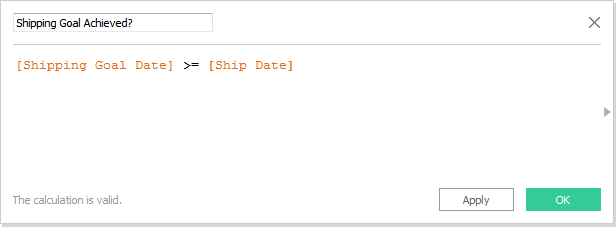
With this new field, we can compare the goal shipping date to the actual shipping date:
Our visualization starts with a distinct count of Order ID on Columns with Sub-Category on Rows. Finally, let’s drag our Boolean field onto Color to divide each bar into shipping on time vs. shipped late:
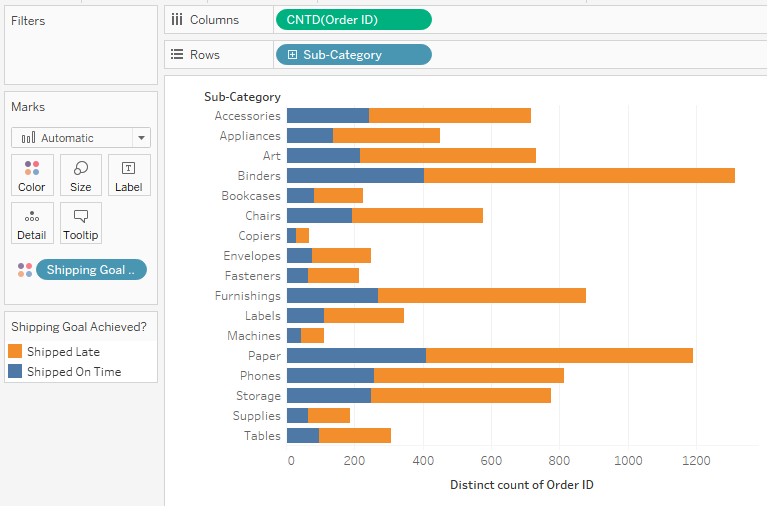
We can see that across all of our products, we have some significant challenges as a business to ship our products more quickly.
DATEDIFF()
Let’s extend our example above by going deeper into our analysis. In the bar chart above, we simply see whether a product was shipped on time or not. It would be interesting to see the variance of how fast or how slow the product is shipped compared to the goal. We’ll use DATEDIFF to make this analysis.
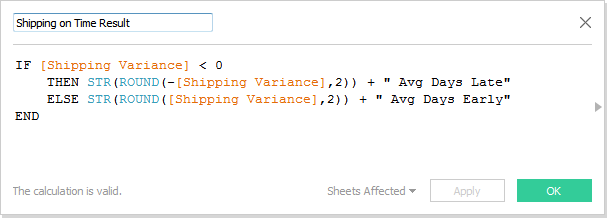
We’re going to find the average difference between the goal shipping date and the actual shipping date:
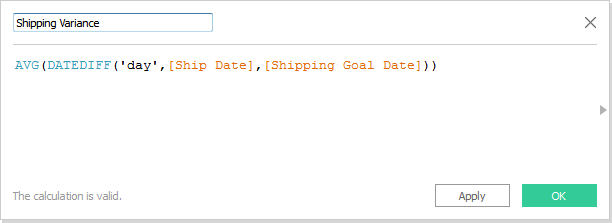
If I simply had Ship Date – Shipping Goal Date, Tableau will produce a result back to me in days by default. For this example, that works fine. The big advantage of DATEDIFF is that you can specify what unit you want to return back (weeks, months, etc). I put ship date in the start date and the goal shipping date in the end date, so any products that were shipped late will show up as a negative value. Let’s clean this up so it’s a bit easier for our reader to understand with another calculation:
I’ve put the calculation into a text table:
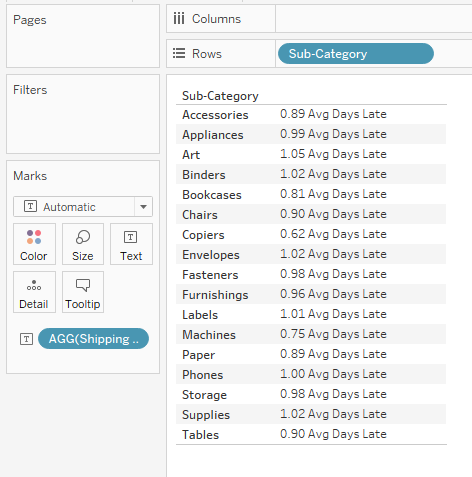
While most of our products are shipping later than we’d like according to our initial bar chart, DATEDIFF reveals that if we can expedite our processes by a single day nearly all of our product sub-categories will meet our shipping goal.
DATETRUNC()
Let’s add another wrinkle to the above scenario. Instead of having a goal shipping date for all of our products, let’s say that our products ship on the first of each month. We receive orders throughout the entire month, but the ship date will always be the first day of the following month.
DATETRUNC is an easy way to solve this problem. This function truncates a date to the specified date part. It removes all of the date parts that are lower in the date hierarchy. For instance, if we put March 6, 2016 into the DATETRUNC() function with the date part set to month, the date will truncate to March 2016 (or March 1, 2016). If we set the date part to quarter, then that same date would truncate to Q1 2016 (or January 1, 2016).
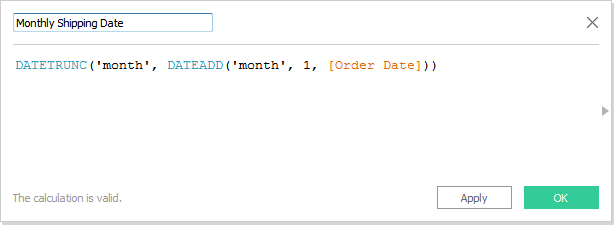
Let’s solve our use case. If we just use DATETRUNC, we’ll get the first day of the month. That won’t work as it’s impossible to ship a product before its ordered … unless Professor X manages our inventory. So, we’ll have to add a month to our date field first and then truncate back down to the month date part.
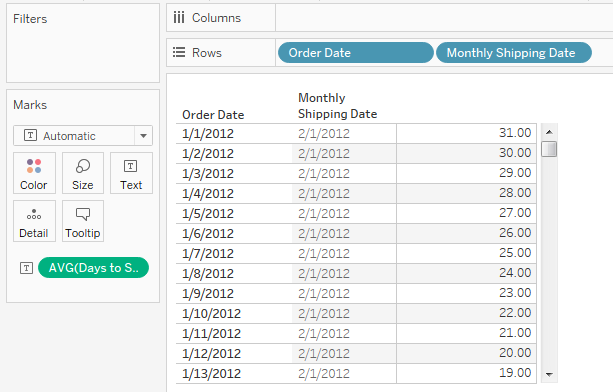
We can use this function on our visualization in combination with our DATEDIFF to see what the ship date will be and the days it takes to ship from when the product was ordered. Here’s the DATEDIFF calculation for this view:
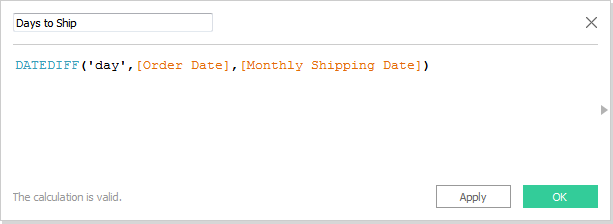
And here’s our final view:
Hopefully, these examples starts to spark your imagination on how you can use these date functions to apply to your data and your requirements.
What’s Next?
In the fourth article, we’ll explore one of the techniques that I used in this article with exact dates and making them discrete. I’ll use the ATTR function to illustrate another use case that might be helpful for you. Until then, any questions or thoughts are appreciated in the comments section below.