
Tableau Deep Dives are a loose collection of mini-series designed to give you an in-depth look into various features of Tableau Software.
In our final article in the Deep Dive on Dates, we’ll explore how to take a start date for different products and normalize it to a wee- by-week comparison from week one forward.
This article was inspired by one of my Desktop I: Fundamentals students from a Melbourne Public class last year. They worked for a publisher and wanted to show an apples-to-apples comparison of performance for new titles that they’ve released. To accomplish this, we’re definitely going to need to combine a lot of the date techniques we’ve learned during this deep dive.
To illustrate our example, let’s grab the top five movies that were released in 2016 using data from Box Office Mojo.
Running Sum
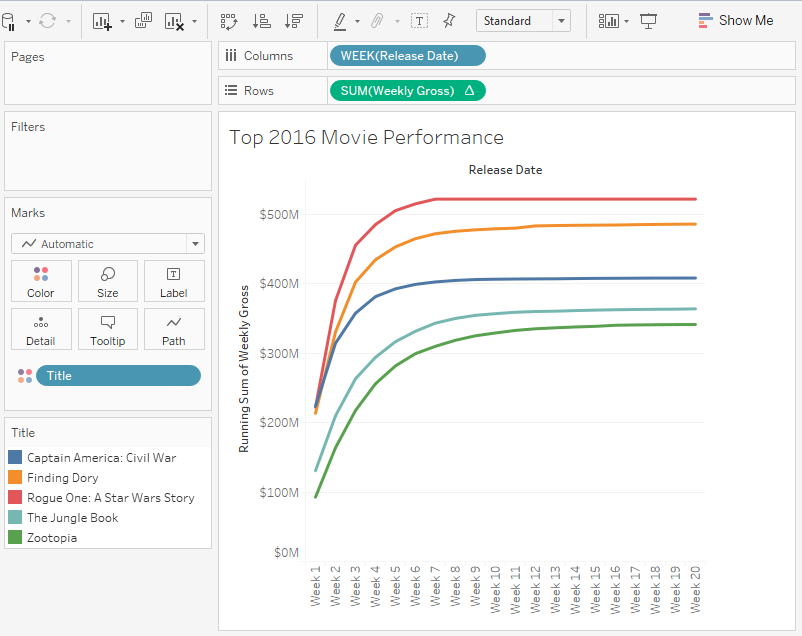
I want to compare each movie side by side from a relative week one rather than the actual release date. If I just put them into a view without using my date functions, I’ll get a view like this:

For the view above, I put a Running Sum table calculation on the Weekly Gross measure:
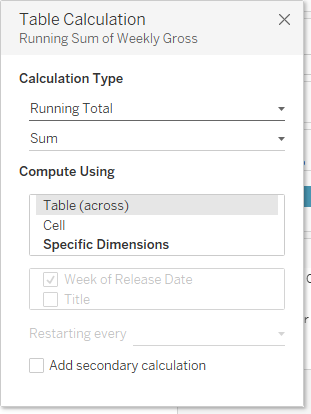
My dates are represented as a continuous date for week number, which spreads my movies out all over the line graph.
Resetting the Week Number
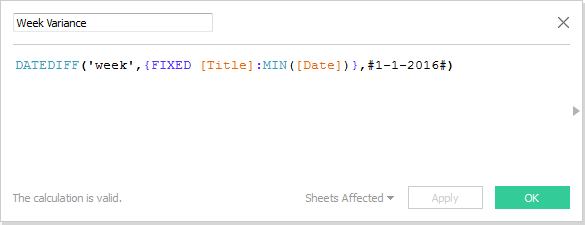
The solution is to use a discrete date and to reset the date back to week number one. Let’s start by calculating the difference from week one to the actual week the movie was released. To accomplish this, we’ll need to dip back into our Level of Detail calculations! They really show up all over the place once you get comfortable with them.
We’ll use the following formula:
Let’s pause and check our math in a text table, comparing the actual start with our calculation above. I highly recommend you take this extra step to ensure that your LODs are working properly. Let’s set up our text table with each movie title and the release date as row headers.
To show the first date, we need to set our date field to MIN(). To get that exact date to show up as a header, which is by default continuous, we can hardcode it as discrete.
Here’s our table with our LOD calculated field, Week Variance as the text label:
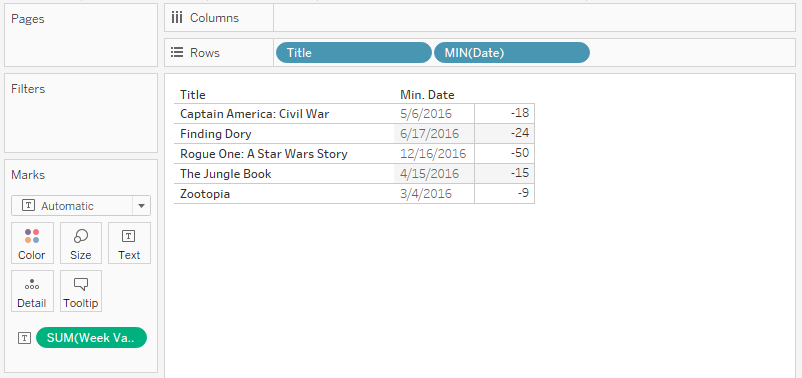
“Rogue One” was released in mid-December (Dec-16). The -50 calculation that’s showing up on that row means to get back to our relative week one, we must subtract 50 weeks from the start date. Our results are as expected, so let’s continue to the next step.
Week-by-Week Performance
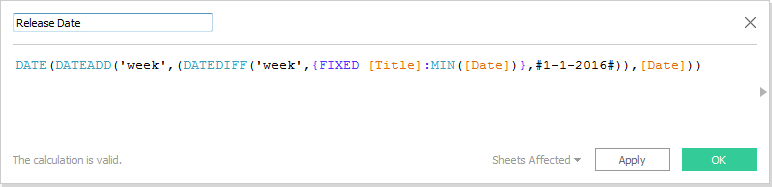
Now that we have the variance using DATEDIFF, we can then apply it to our Week date field with DATEADD to reset every movie release to a discrete week one. I’m going to wrap the entire calculated field in the DATE () function to make sure the data type stays at date rather than date & time.
Here’s our updated calculation:
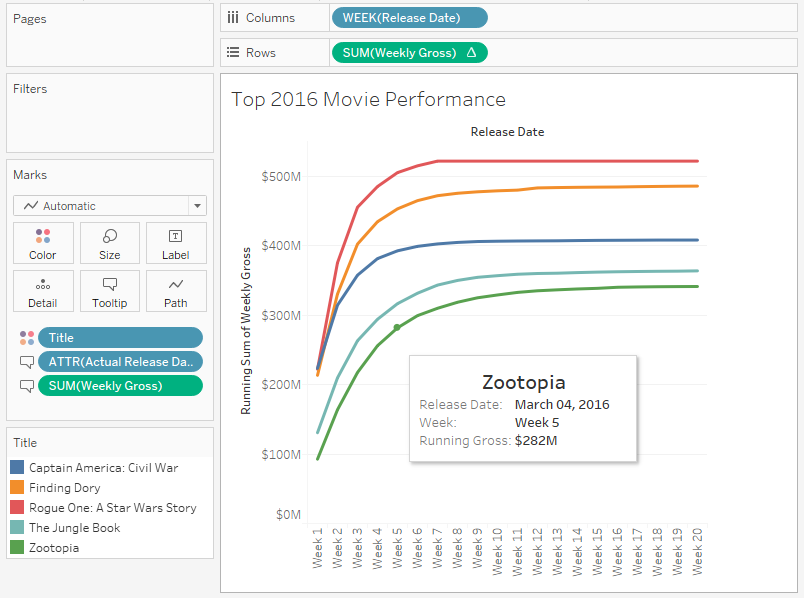
Now we are ready to build our view using our Release Date calculated field that we created above as the week date part (i.e., discrete):
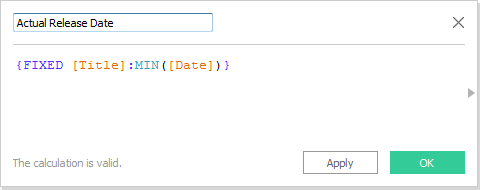
To make our viz just that bit more helpful, let’s add the actual release date into the tooltip. We’ll re-use our Level of Detail calculation to find the minimum date:
Finally, we’ll grab this new calculation onto our tooltip and do a little clean-up to make it user-friendly:
What’s Next?
That’s it for dates. We are finito for this deep dive! Please let me know if you have any thoughts or questions in the comments section below. And be sure to stay tuned to the InterWorks blog for all of the great content from our business intelligence experts for more data and more Tableau tips and tricks.
Cheers, and thanks for reading!