
Tableau Extended takes topics from Tableau Desktop training courses and expands upon those lessons for advanced functionality and use cases.
In the Tableau Extended series, we are exploring all of the extra features that aren’t covered in the Tableau Desktop curriculum. Think of this series as a companion to your Tableau Desktop training experience. In this article, we’re going to continue to explore the Data Connection Page that we started in previous article. Using either the Data Preview or the Metadata Grid option, you can pivot your fields for a different format to the data from Excel, text, PDF and Google Sheets data sources.
Let’s examine this feature with a specific example.
Sample Data
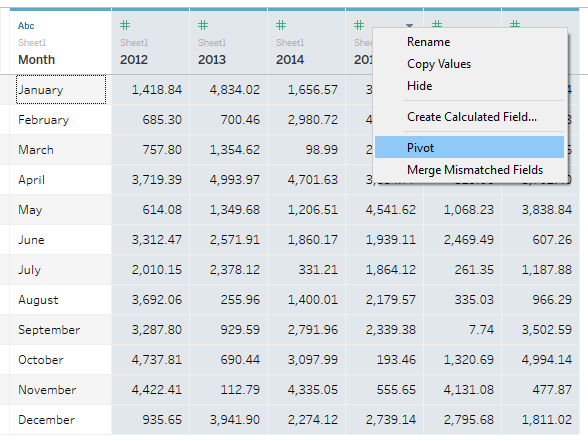
There are a lot of data sources that would benefit from a pivot in Tableau. Here’s one such example that I’ve seen several times where dates are divided between rows and field headers:
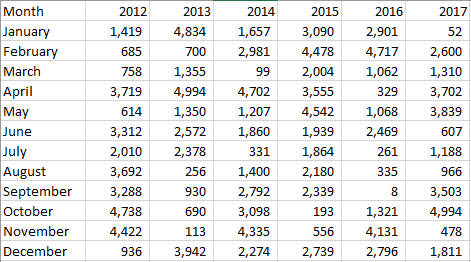
In this format, our date fields are divided with years being column headers and individual months within the Month field. This is a useful view, but the structure of the data limits the other things that we might do with this data. Let’s import this into Tableau Desktop first and then make it more versatile with a pivot.
Here’s the Excel file for the above data source for your own practice.
Preparing the Table
After we’ve connected to the table, we can see that Tableau Desktop has made some incorrect assumptions about the data and the field headers. Have a look:
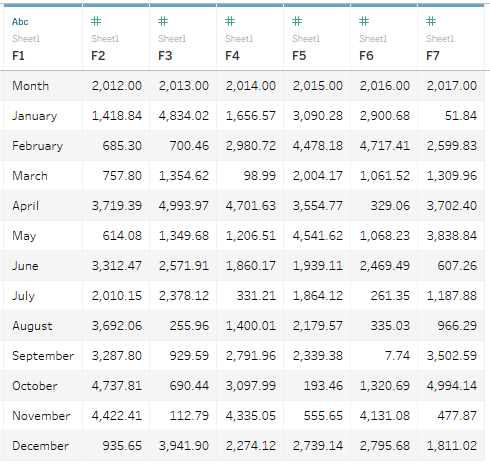
Tableau Desktop algorithmically analyzes data when it is imported. When Tableau saw this data source, it saw a column of strings followed by six columns of numbers. It did not recognize Month or the Years as field headers. We can fix that.
I’m going to right click on the selected sheet for this data source. The default option selected is Generate field names automatically, but I want to switch it to Field names are in first row:
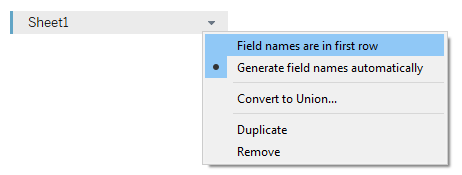
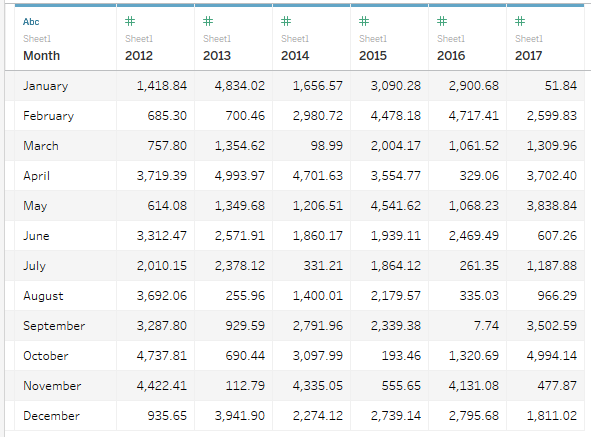
This removes the F1, F2, etc. field headers and instead uses row 1 from the sheet as the field names.
We are now ready to pivot our fields.
Pivoting the Fields
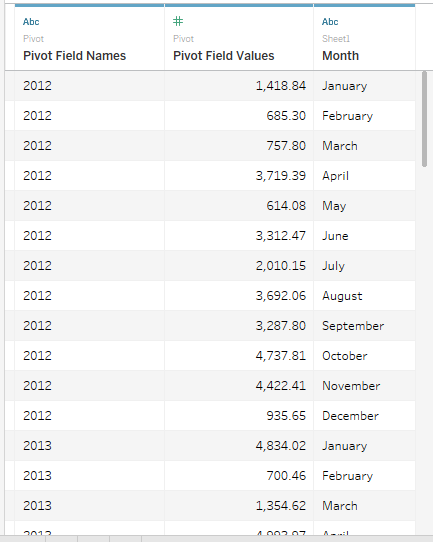
Pivoting our fields means that we are taking all of these Year columns and combining them into a single column. An easy way to think of this is that rather than Years being in a crosstab across the table horizontally, we are combining them into one field that reads vertically. The numeric data contained in each Year field is then pivoted, i.e. rearranged, accordingly.
To pivot fields, select the field headers that you want to combine into a single column by holding down the CTRL button and then right-click.
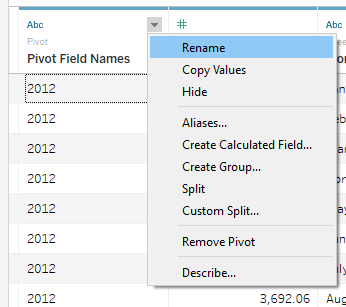
When Tableau converts these into pivoted fields, it generates generic names for the two new columns: Pivot Field Names and Pivot Field Values.
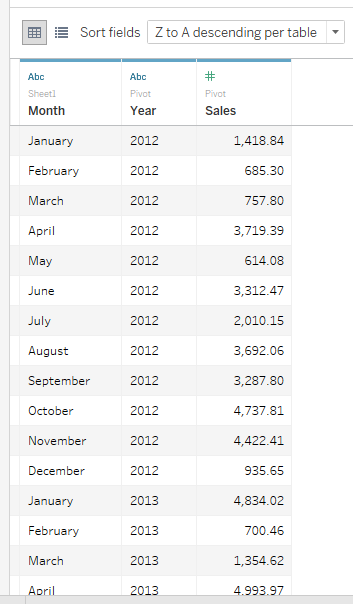
Let’s rename each column according to Years and whatever our measure represents. How about Sales?
Let’s change the Sort fields drop-down to Z to A descending per table just to see the fields in a more logical order. Here’s what we get:
The final step for this particular example is to combine the Month and Year field into a date data type that we can use as a Date Part or Date Value, the full range of options, using the DATEPARSE function. Here’s the calculation you would use to do that:
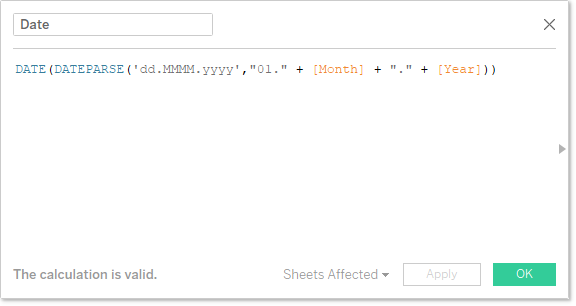
Learn more on the DATEPARSE function with my Deep Dive on Dates.
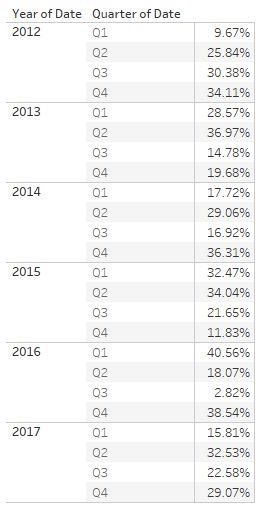
Final Result
Now that we’ve got our fields prepared and converted into a proper date data type, it opens the doors for a lot more options when creating your analysis. Here’s an example using a % of Total table calculation for quarters by year that would have been very difficult to achieve with the crosstab that we started with:
What’s Next?
We are going to continue talking about the features on the Data Connection Page with our next article in the Tableau Extended series when I examine the Data Interpreter. Until then, leave any questions or thoughts in the comments section below.
And if you’re looking to apply a data pivot to other types of data sources (such as SQL for instance), consult this Tableau article for more assistance.