
Quantified self visualizations predominantly focus on daytime activity, not sleep habits. Perhaps this is because it’s one of the most difficult things to accurately measure, or maybe it doesn’t seem like an interesting data set. But, anyone with a newborn in the house knows how sleep (or lack of it) can quickly become a major focus of daily life. This visualization portrays that change based on data from my personal fitness tracker.
A Few Points About the Data
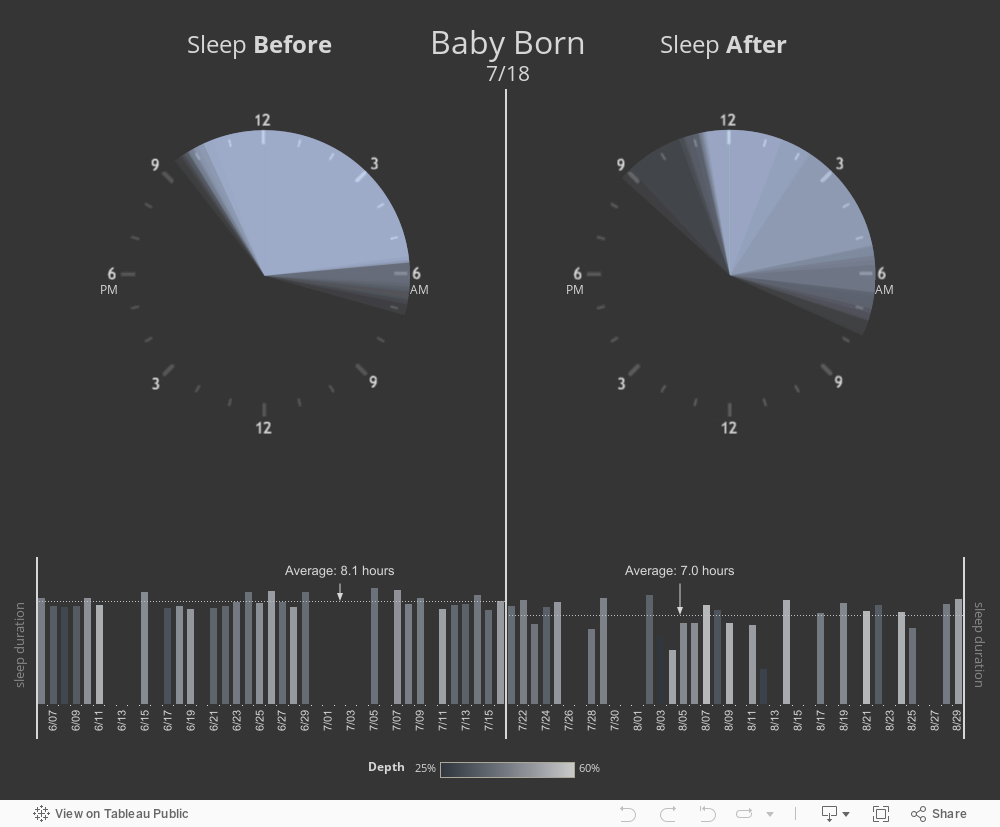
Looking at the viz above, the data mirrors our expectations. Granted dropping from eight to seven hours isn’t much to complain about, but bed times and wake times are now more erratic. As a result of this increased variability, getting a solid block of restful sleep becomes a little more difficult, and the likelihood of me being fatigued the next day increases. Such is life in a house full of tiny humans.
One big thing you may have noticed is that there are gaps in the data. That’s because I don’t hit the button or wear the tracker every single night. I could have hidden those gaps, but I think it’s important for this data visualization to show them in their entirety as they may affect the conclusions we draw. I also like that it illustrates genuine human behavior, because the reality is, especially when kids are involved, that our behavior isn’t always consistent.
Finally, and perhaps most important of all, I should note that Mommy doesn’t track her sleep like I do. If she did, I guarantee it would not look anything close to mine! Still, as you can see, Dad is measurably affected.
Choosing a Chart Type in Tableau: Sweet, Yummy Pies
Some of you are thinking: “What kind of chart is that, anyway? Is that even legal in Tableau?” Circular views of various kinds (pie charts especially) are often derided among data visualization critics. That said, there is certainly a time and place for them. The main exception in which they work quite well is when the data is cyclical.
Because I’m displaying sleep cycles, I wanted to try a different approach and see how a circular view would work out. Not only did I start with the oft-hated pie chart, I made 30 overlapping semi-transparent pies on each side to achieve a gradient effect showing variation in sleep/wake times. Using a 24-hour clock face as a background image is more unusual than a linear time scale, which I think adds visual interest while remaining reasonably intuitive. All of that combined makes the resulting Tableau viz something very different than a typical pie chart, so I think it’s safe from the pie-haters.
In this case, breaking some of the so-called “rules” (or simply deviating from normal chart types) is both fun and effective. After all, it’s important to remember that Tableau best practices are more guidelines than strict rules. Nine times out of ten, they’re spot on. But every now and again, going against the grain can produce some interesting if not more impactful results.
Have some rule-bending examples of your own? I’d love to see them. Just drop them in the comments section below. As always, questions are welcome.