
The Drawing Tool has been incorporated into CBI Studio by InterWorks. Explore CBI Studio to see what’s new.
When I first started using Tableau, I was most excited to start trying out the map tool. It can take city names, zip codes or country names and turn them into map coordinates to display visual geographic data. After playing around with these features for a while, you may come across a task where you need to create your own maps. It could be a city map drawing of districts or, in my case, the floor plan of an event venue.
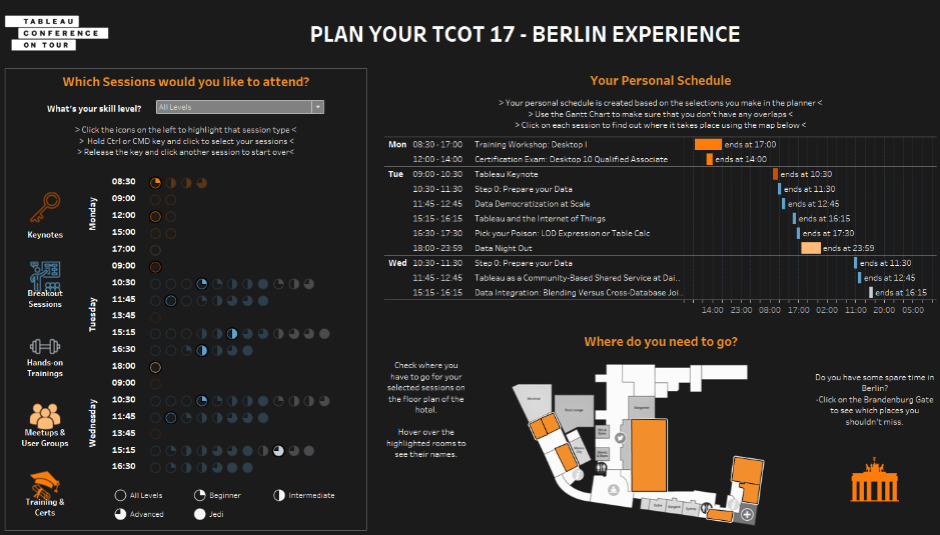
For the 2017 Tableau Conference on Tour in Berlin, I wanted to create a Tableau dashboard that could be used as a scheduler app for the event attendees. For a single app to render a floor plan so visitors can easily navigate to their next sessions, it can be a huge undertaking. To create an interactive floor plan, I used background images and polygons in Tableau.
You can explore my final dashboard on Tableau Public or click the image below.
These two functions can be used to add a background image to a worksheet that is fixed to a coordinate system with an X axis and a Y axis. You only need a PNG or JPEG image file. I recommend using a PNG format if you have transparency in your image, since JPEG doesn’t support transparency.
Step 1: Using Tableau Polygons
The easiest way to draw polygons on a background image is by using the Drawing Tool. You can sign up for a free trial here. Next, I’ll show you how to turn your image into a map Tableau can work with. You can also follow this short video tutorial that describes how to draw polygons that are used on maps rather than background images.
Once you’ve opened the Drawing Tool in your browser, upload your image by dragging it onto the grey area. For this demonstration, I am using a floor plan of the Gamescom convention centre in Cologne, Germany, the world’s second largest gaming event.
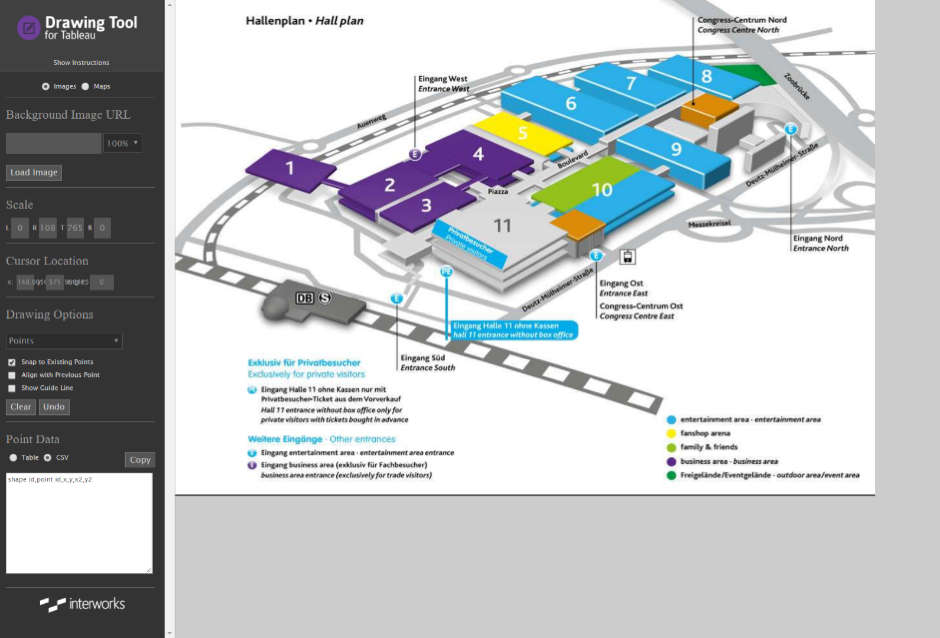
Above: How to upload an image to the Drawing Tool for Tableau
You can now choose whether you want to draw points, paths or polygons under Drawing Options. Polygons are shapes that consist of several points, exactly what we need. Start drawing by clicking in each corner of each hall in the conference centre. Double-click the last point of each room to connect it to the first point and close the polygon.
Quick Tip: You can move single points of the polygon after you have completed it by dragging them where you want them to be.
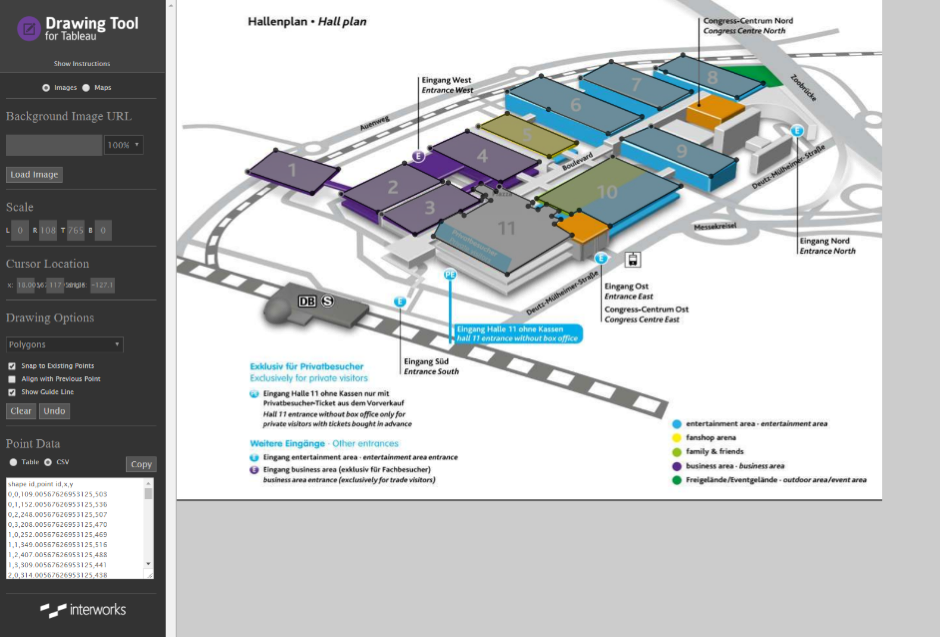
Above: Demonstrating how all areas are drawn on the floor plan
Step 2: Using Shapefiles in Tableau
Once you’ve finished creating polygons, you can copy all the text from the Point Data area into a text editor and save as a CSV file.
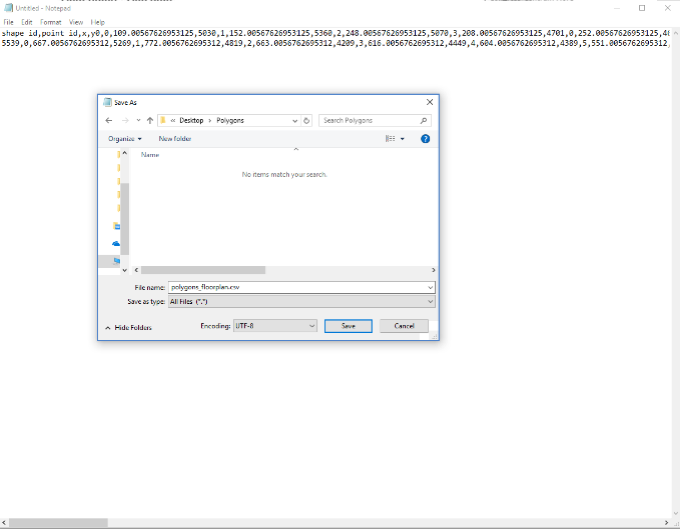
Above: Save as a CSV file
To open your shape file in Tableau, add a new data source and connect to your CSV file. Connect to Data -> Text File -> floor plan CSV.
Step 3: Adding the Background Image
On your worksheet, open the Map menu and click on the name of your shape in Background Images.
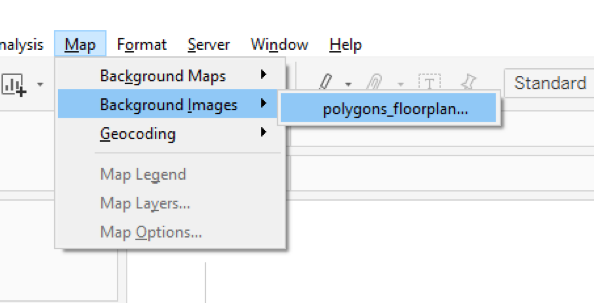
Above: Adding the background image to your floorplan
Add an image and navigate to the image file that you have previously uploaded to the drawing tool. You will then need to define the X and Y fields. In our case, these are just the X and Y fields in the datasource. Subsequently, you will need to define the dimensions of your image so Tableau knows where to put the points on the coordinate system. For that, you need to find out the width and height of your image in pixels. This can be done by hovering over the image file in Windows 10 or by going back to the drawing tool and reading the numbers in the scale fields.
Quick Tip: In case your image does not display correctly because it is too big, go to the Options tab and activate Always show entire image.
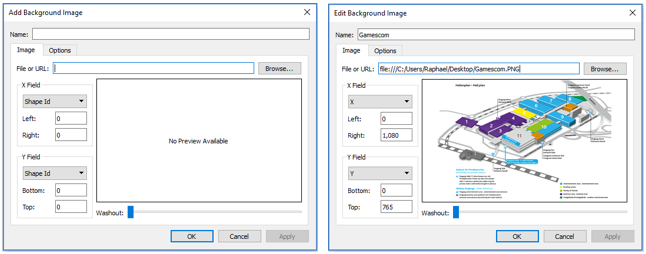
Above: How to scale your image
Once this is finished, click OK and go back to your worksheet.
Step 4: Adding the Shapes to Your Visualization
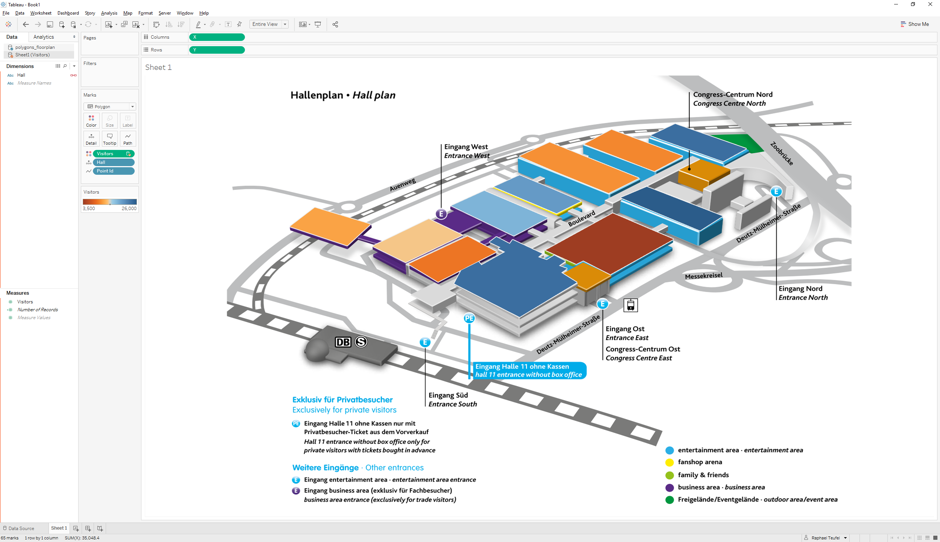
The shapes can be added to your view by dragging the X field to Columns and the Y field to Rows. Then go to the Analysis menu and click Aggregate Measures so the measures are disaggregated. Next, change the Marks to Polygon, add Shape ID to detail and Point ID to path.
Quick Tip: To bring data into your map, blend with another data source on Shape ID. Use Aliases to match to your shape names.
Below is an example of bringing in hypothetical visitor counts:
And that’s all there is to it! Be sure to check out my 2017 Tableau Conference on Tour Berlin dashboard while attending the event. I hope it helps your #data17 experience!