
The Tableau Performance Checklist series is designed to help you streamline your dashboard performance and Tableau Server configuration. Each post expands upon one item listed in the master Tableau Performance Checklist. As of 2024, you can find an updated Tableau Dashboard Performance Checklist here.
In this post, we’ll be looking at one of the features that makes Tableau a great data exploration tool. So, put on your miner’s cap, and let’s go spelunking! Specifically, we’ll be covering this point in the Data section of the Tableau Performance Checklist:
“Use ‘Describe’ to explore dimensions in new data sets without having to load them into a viz (keyboard shortcut CTRL+E).”
Tableau is good at so many things, and data visualization is just one of them. The first thing you’ll notice when you connect to a data source in Tableau is how it divides out your data into dimensions and measures. That in and of itself is telling, as you can now see exactly what your data can be used for.
Dimensions are used for distributing your data into chunks/groups/buckets. These are things by which you slice and dice your data. When dragged into a view, dimensions create row and column headers. Then you have measures, which are things you can do math on (I like that Tableau is alliteration-friendly: measures = math). These are typically continuous-based data fields that, when dragged out into a view, create an axis rather than a column/row header.
But what else does Tableau tell us about our dimensions and measures? Let’s have a gander:
In the Data window, you’ll immediately notice that each field has some sort of icon next to it to tell you what type of data Tableau sees it as:
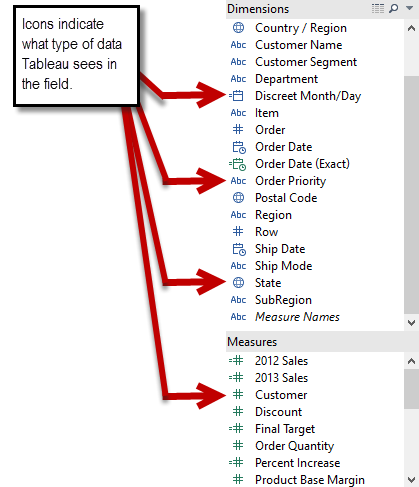
That’s slick. Now, Tableau may not get it right, but you can always use the Right-click menu to make corrections and change the data type:
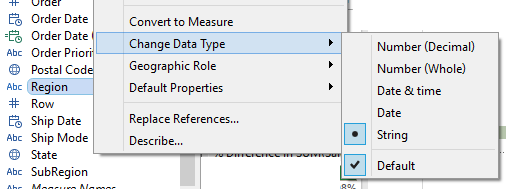
Very helpful. Thanks, Tableau!
Hello, ‘Describe’
Something else you may notice on the Right-click menu is the word “Describe.” What does that do? Let’s take a look:
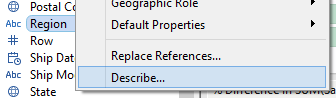
If you choose Describe from the menu, here is what you will see … a veritable treasure trove of information about the field (either dimension or measure) that you’ve selected:
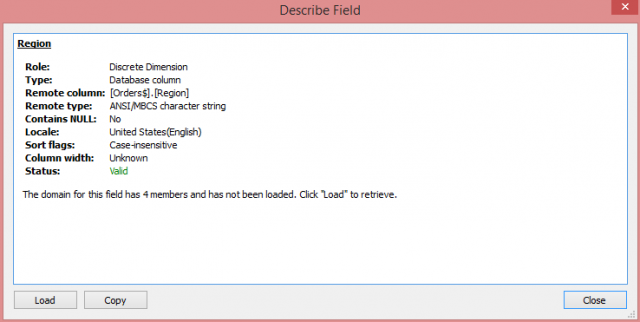
Wow. Look at all that! Let’s look through these delicious details.
Role: This is where Tableau tells you how it’s going to interact with this field when it’s used in a view. In this example, the Region field from Superstore Sales, it will tell you that it’s a Discrete Dimension, so when I drag that field out onto the Rows or Columns shelves, it’s going to show me a row or column for each member of the dimension.
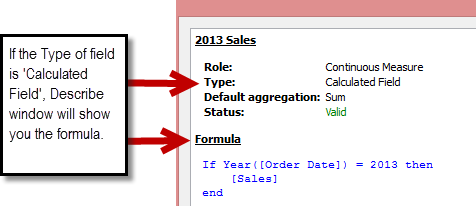
Type: This tells me this field is a database column. Another option might be that it’s a calculated field. Calculated fields are created in the workbook itself rather than native to your data source. Here’s an example of how that would look in the dialog window:
Remote Column: This is the name of the column in the underlying data source. I love this, because if you’re fond of renaming your fields in Tableau to make them more meaningful (because DBAs tend to use weird naming conventions … sorry, DBAs), it can be tricky to remember what the field was originally named. Using the remote column information, you can make sure to reference the right field name if you need to call up your DBA and ask for something that involves this field. SCORE!
Remote Type: Here again, this is referencing the underlying data source and telling you how it sees that particular field. Just like you can assign a new name to a field in Tableau, you can also assign a new data type. An example of this might be something like Postal Code. Many databases assign this type of data as numeric, but you may want it to behave as text in Tableau. Did you forget a field’s original data type? Use Describe to find out what it was.
Contains NULL: Does your underlying data have any nulls in this field? If so, here’s where you’ll find out.
Locale: Was your Workbook created for use in the UK? This flag in the Describe dialog will tell you that. Setting the locale, as described here, tells Tableau how to display certain information according to local preferences. For example, European dates are often shown as dd/mm/yy rather than the mm/dd/yy format commonly used in the U.S.
Sort flags: Is the underlying data source sorted by this field? If so, in which position? When underlying data sources are created as views, from a SQL database or Access database for example, that view or query may be sorted by one or more fields. If the field which you’re describing is a party to such a sort, this is how you’ll know.
Column width: If the field has a specified fix-width in the underlying data source, often seen with ODBC connections such as SQL Server or Oracle, then that value would appear here.
Status: When it comes to calculated fields, sometimes a measure or dimension that is used gets changed or deleted. This would make the calculated field invalid, and you’d see that indicated here. TIP: in the Data window, invalid calculated fields are indicated by a red exclamation point (!).
But wait … there’s more! Did you catch this little line right here?
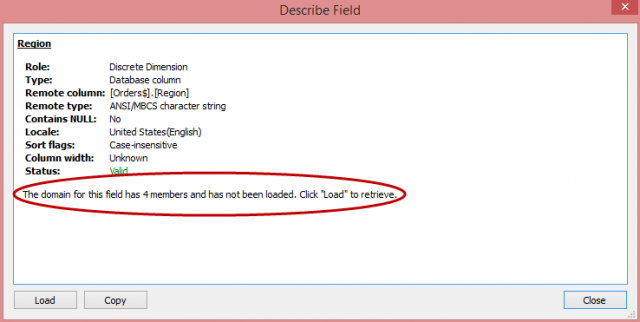
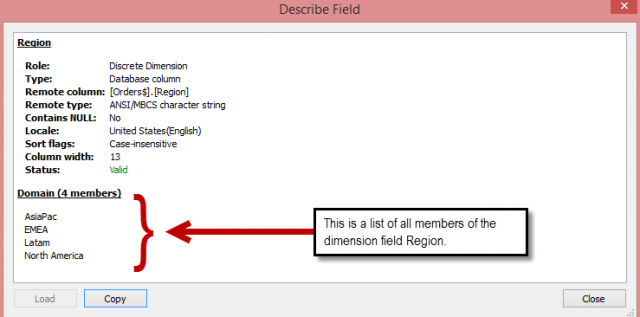
Clicking Load will show you exactly what’s in that field. For dimensions, it will list out all members of the dimension, like so:
For measures, it will list the range of values in that measure. Holla!
Does it get any better than this? Right there, built into Tableau, is more information about your data than you can hardly imagine. All you need to do is right-click on your field and Describe to search the caves of knowledge that Tableau has to offer about your data!
Mastering Best Practices
If you’re interested in becoming a Tableau Server guru, then learning these performance best practices is essential. Check back frequently as we add new posts and dive deeper into each point in the Tableau Performance Checklist.
Another great way to identify best practices is to leverage the insights offered by our Performance Analyzer, part of Workbook Tools for Tableau. It will examine all of your workbooks, worksheets, dashboards and data sources against a list of best practices to ensure that you’re using all the tips and tricks to guarantee your visualizations are moving at light speed.
As always, feel free to get in touch with us if you have any questions regarding performance or anything Tableau related! We’d be happy to help.