The Tableau Performance Checklist series is designed to help you streamline your dashboard performance and Tableau Server configuration. Each post expands upon one item listed in the master Tableau Performance Checklist.
Quick! Minimize those quick filters!
The Tableau Performance Checklist is a guide to assist you in creating the most efficient and fastest dashboards and visualizations possible. The list is drawn from the collective experience of our award-winning Tableau professional services team. We’ve divided the checklist into different categories. Today, we’ll start the Filtering category with the following guideline:
“Minimize the number of quick filters. Use dashboard filter actions where possible.”
Keep in mind that the Tableau Performance Checklist is not an absolute list of rules that must be followed. Does such a beast even exist? In the real world, your dashboard may use quick filters without any impact on performance. It can happen! That said, if your dashboard is feeling a little sluggish lately, maybe not as bright-eyed and bushytailed as usual, then have a gander at the list to see if something on it jumps out as a potential issue.
Onward and upward, then. Let’s have a look at what quick filters are and how their use (or overuse) might be causing your dashboards to slow down.
What Are Quick Filters?
Filters are what limit your view to a subset of the overall data in your data source. Supposing you wanted to show sales figures by state, but you only wanted to show Texas. Add a filter, choose Texas and you’re all set. Fantastic! Until … someone else wants to see sales by their state. (Why anyone would want to live in a state not called “Texas” is a topic for another blog …) How do you let the user interact with that filter on a dashboard? Dashboards don’t have the Filters shelf, so we have to provide another mechanism for users to be able to select from the available fields.
Enter quick filters. Quick filters are an easy way to add a level of user interactivity to your reports, and here’s how you do it:
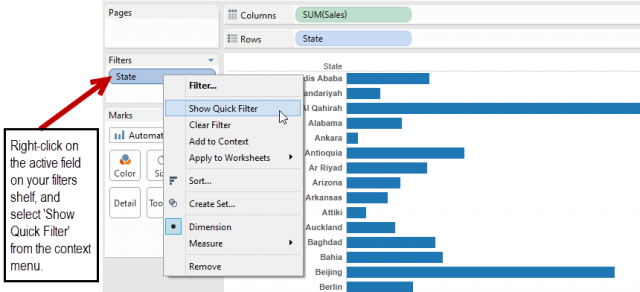
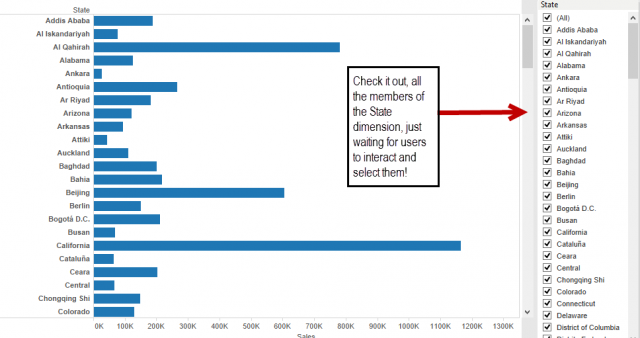
Once you Show Quick Filter, the list of available options for that dimension (or measure, depending on what you’ve filtered by) will show up to the right of your visualization, thusly:
The cool thing about quick filters is that they can be set up to apply in one of three ways:
- To a single view as a local filter
- To all of the views that are built on a data source (called a global filter)
- To any combination of individual worksheets, selected from those available in the workbook
To find out more about filtering in Tableau and how to use quick filters in detail, have a gander over here at this link.
Impacting Performance
Alright, so now we know that quick filters are great for interactivity, but using them inappropriately may cause performance problems on your dashboards. Wait, what? What do you mean? Allow me to explain …
Adding a quick filter is just a right-click for you as the Visualization God/Goddess, but underneath the hood, Tableau has some work to do. For every quick filter you add, Tableau has to run a query against the database to determine which values to display for your selected dimension or dimensions. If you have a lot of data and there are a lot of options, then Tableau’s doing a lot of work back there. It has to query the database for all possible filter options for all of the quick filters.
If you have two or three quick filters for each visualization in a dashboard locally, then you’ve added quite a bit of extra lifting that Tableau has to do before it can render your dashboard. Not only does Tableau have to generate all of the different members like I pointed out, but it then has to apply any display rules for that filter. Meaning: It has to apply relevancy if you’ve selected Use Relevant Values, and it has to format using the style you’ve chosen (Single Value – List, Single Value – Drop Down, etc.)
So, you can see that with a full dashboard, there could potentially be hundreds of different values that must be returned for display. Not optimal for performance, my friends!
Filter Actions
A better option than employing a lot of quick filters is to instead use dashboard filter actions. Unlike quick filters, action filters on a dashboard do not generate additional database queries. Using dashboard filter actions is also better for the user because they can filter as many of the views on the dashboard as they want. This allows the report consumer to view all of the reports on an apples-to-apples basis.
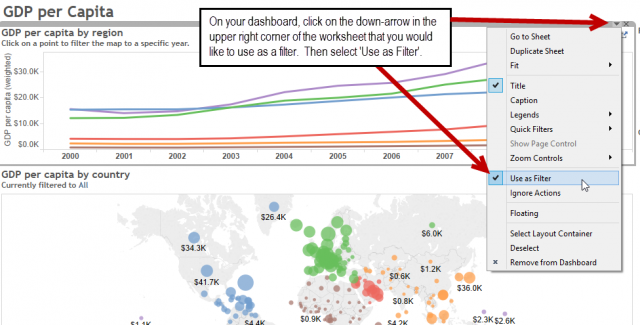
Here’s how you create a dashboard filter action. First, start by using the drop-down arrow on one of the visualizations in your dashboard and select Use as Filter like so:
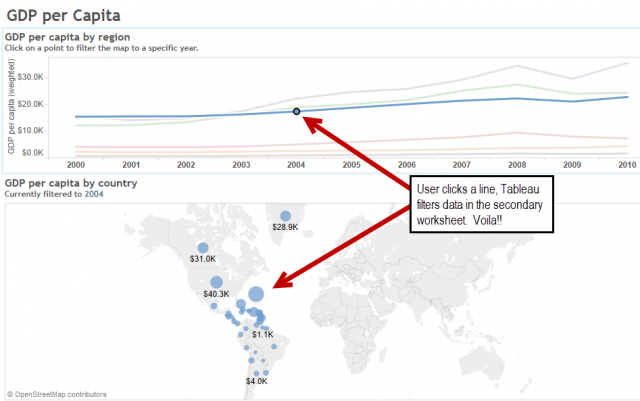
Now when you click on any of the data marks, it will filter the other visualizations based on your selection:
In addition to avoiding potential performance degradation, you’ll find that your dashboards will be a lot cleaner and more intuitive to use if you remove all of the clutter of excess quick filters. This is not to say that a quick filter may not be useful … they surely can be! Just make sure that the ones you use are a necessary part of conveying the story of the data rather than tossing them onto your dashboard willy-nilly like so many bells and whistles!
Mastering Best Practices
If you’re interested in becoming a Tableau Server guru, then learning these performance best practices is essential. Check back frequently as we add new posts and dive deeper into each point in the Tableau Performance Checklist.
Another great way to identify best practices is to leverage the insights offered by our Performance Analyzer, part of Workbook Tools for Tableau. It will examine all of your workbooks, worksheets, dashboards and data sources against a list of best practices to ensure that you’re using all the tips and tricks to guarantee your visualizations are moving at light speed.
As always, feel free to get in touch with us if you have any questions regarding performance or anything Tableau related! We’d be happy to help.
The Latest
-

Kickstarting Data Innovation in Healthcare
18 April, 2024