
I have a love / hate relationship with the Attribute function in Tableau. I love it for what it does, I hate it for those times that someone asks me to describe what it does. It took me a long time to wrap my head around what ATTR() does in Tableau.
The first stop in my journey to understand the Attribute function was the Tableau online help. There, I found the following definition under ‘Aggregating Data’:

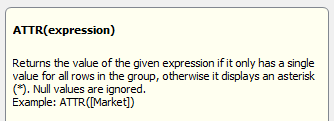
In Plain English
I found this to be useful, but I can see how non-developers might get lost in this formula. My next step to crack this code was to reach out to my team. James Wright offered this definition:
“Attribute is a test for heterogeneity across the rows in the result set or homogeneity, depending on your perspective. Does every row have the same value? If so, value. If not, *.”
I LOVE this definition, but as Rob Austin in our UK office pointed out, it could possibly benefit from some simplification. Here’s how Rob defines Attribute.
“It returns a value if it is unique, else it returns *.”
I found this to be a great definition and very close to the one found in the Calculated Field Editor.
ATTR() in Action
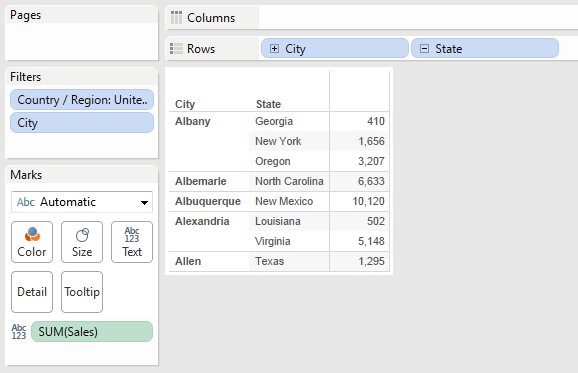
Let’s take a look at some data in Tableau and see if we can make sense of what’s going on based on these four ways of defining Attribute. In the following screenshot, I’ve created a simple crosstab showing the sum of Sales by City and State.
Now, let’s apply the Attribute function to the State dimension.
![Calculated Field [ATTR State]](/wp-content/uploads/sites/default/files/ATTR4.png)
Replace the State pill in our view with the ATTR State pill (from the Measures shelf).
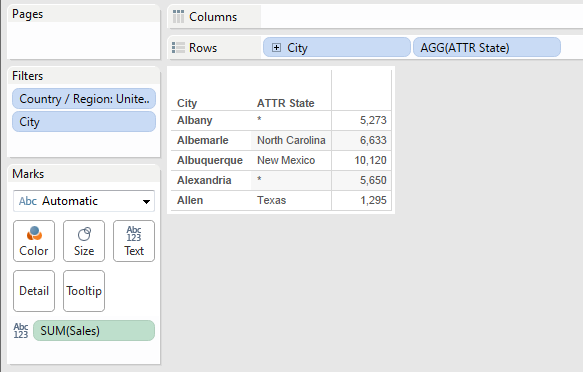
What was the result of this change?
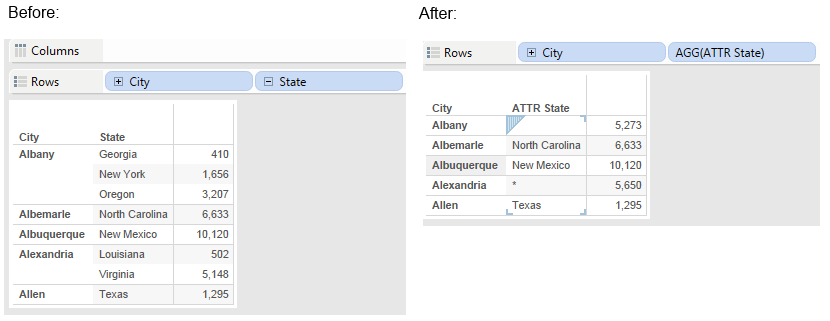
In the “Before” version of our table, we see all three states associated with Albany, one state each for Albemarle and Albuquerque, and two states for Alexandria. When we apply the attribute function to State we see the value of State returned where there was only one possible value (Albemarle, Albuquerque, Allen) and a star (*) returned where there was more than one possible value.
An Explanation
The way I look at this, Tableau is aggregating on the State value and showing us the state when it can: when the min(State) = max(State). In other words, there is only one possible value for State associated with a given city. If there is more than one possible value, it returns the *. I read the * as Tableau’s way of saying, “Hey, I see more than one of this thing, so I’ll show you an asterisk as my way of saying ‘more than one.’” One thing worth noting, the sum of Sales was correct in each instance.
That’s not all there is to this story, I’ll dive even deeper into this puzzle in my next post!