Perhaps one of the greatest things about Tableau is how industry-agnostic it is. Though some industries are predisposed to be more data-driven than others, Tableau is making it criminally easy for anyone in any vertical to get more from their data. As a leading Tableau consulting firm, we’ve seen this from firsthand experience, serving clients in education, retail, healthcare, manufacturing government … the list goes on.
Even though Tableau is ubiquitous, the number one thing our clients want to see is how others in their specific industry are making use of Tableau. It’s perfectly understandable to want a showcase of the possibilities, and that’s what we aim to provide with our “Tableau by Industry” series.
Tableau for Finance
Finance, in my experience, is among the most spreadsheet-oriented, “just show me the numbers” fields in existence. On top of the normal aversion to risk and change, common across all industries, most of the successful individuals in the field have a strong analytical mindset. Their ability to make sense of a table of numbers is a hard-won skill and significant value-add.
However, when these analytical wizards leverage visual analytics, they can dramatically increase their effectiveness at making comparisons, understanding trends and seeing relationships between data sets.
I like to draw on the tragic but instructive example of the Apollo 13 crash, where a room of PhDs looking at tabular instrument readings did not see what anyone looking at a simple time trend of the same information would have immediately recognized as a critical warning.
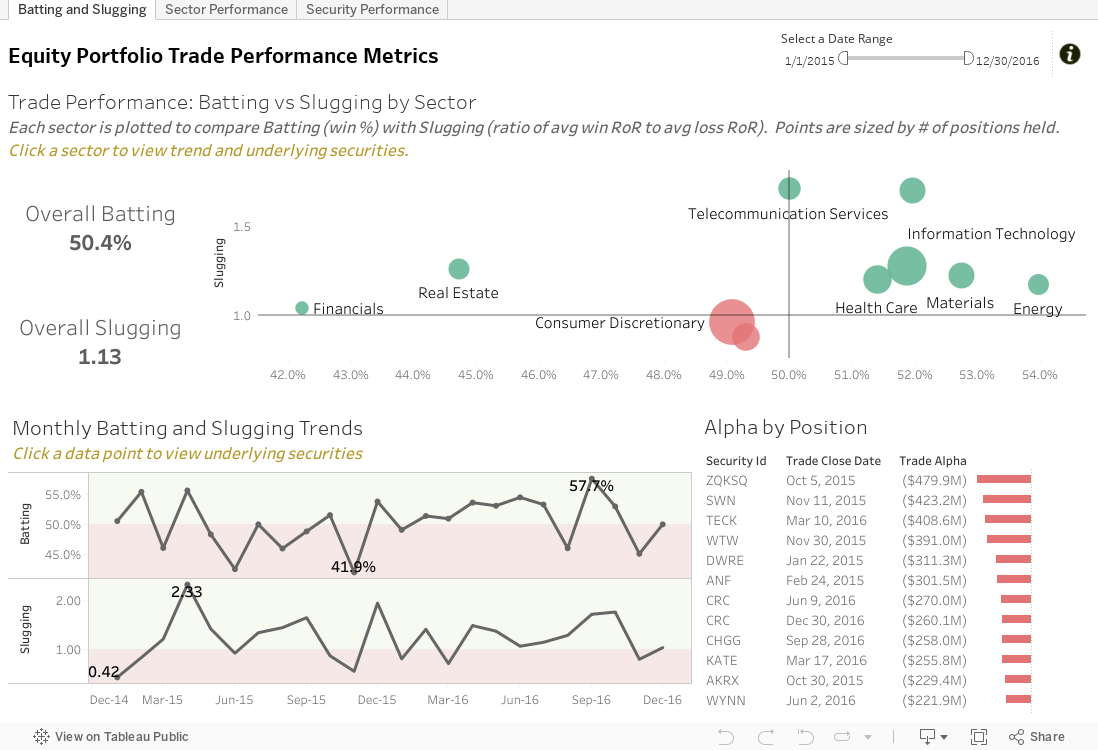
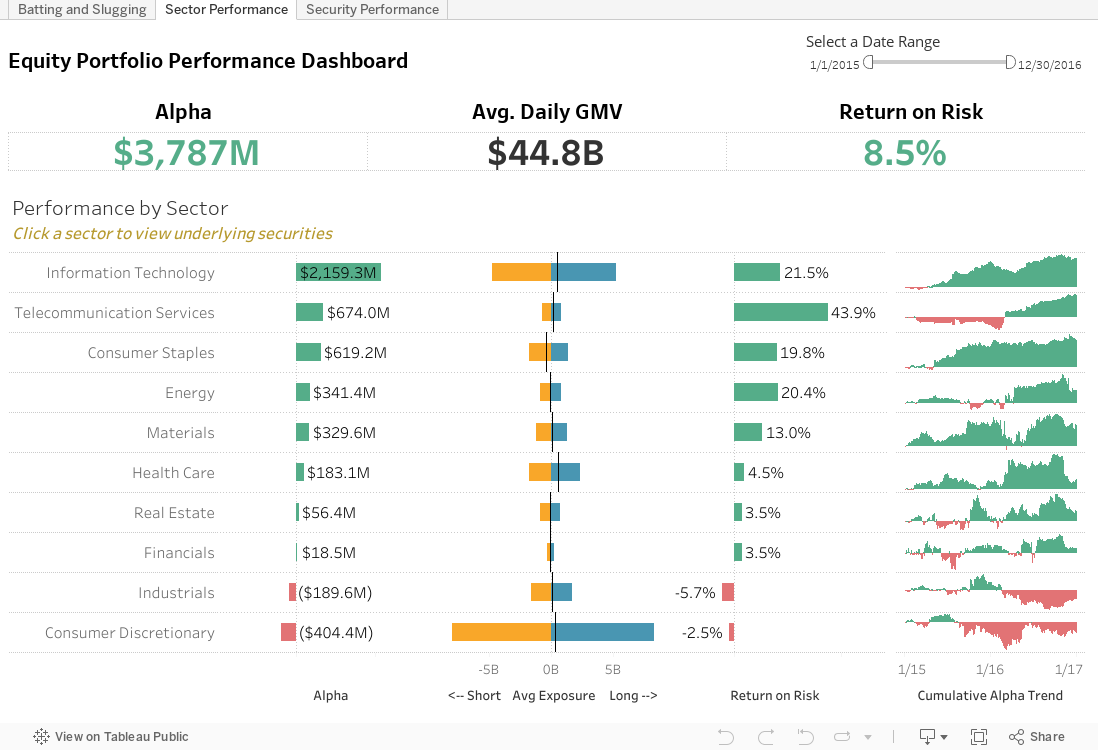
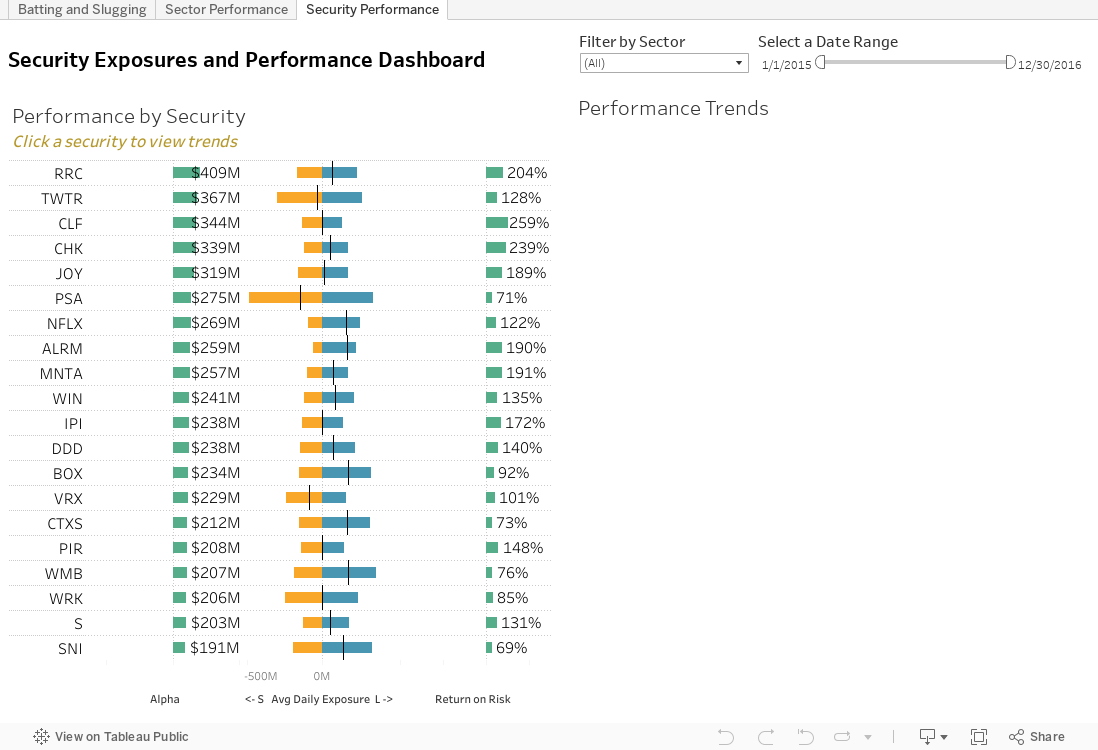
Below, you’ll find sample dashboards for monitoring equity portfolio performance. For users who want to see the actual numbers with the data, there are both data labels and tool tips with the details when you hover over a data point with your mouse.
Each dashboard below has drill-in exploratory functionality to put diving into the details at your fingertips. Both tooltips and drill-ins are great examples of the “details on demand” capability of Tableau dashboards. We hope you find these useful!