
Scenario
Our sales team collects information and forecasts possible sales using a data-table called ‘Opportunities’. If a sales opportunity converts to an actual sales lead, the customer and his information is moved to the ‘Leads’ table. Opportunities that do not convert remain on the original table.
Additionally, there are some sales leads that are added to the ‘Leads’ table even if they didn’t start in the ‘Opportunities’ pipeline.
Our data is collected in two Microsoft Excel worksheets in the same file. We need a visualization that shows all Customers, possible or actual, and compare the estimated sales against the actual sales.
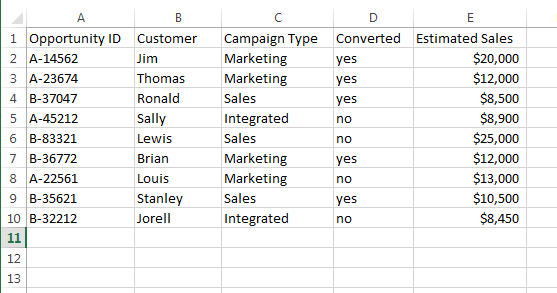
FIG1 -Table one (Opportunities$) shows a list of possible sales opportunities, identified by an Opportunity ID and an estimated sales forecast.
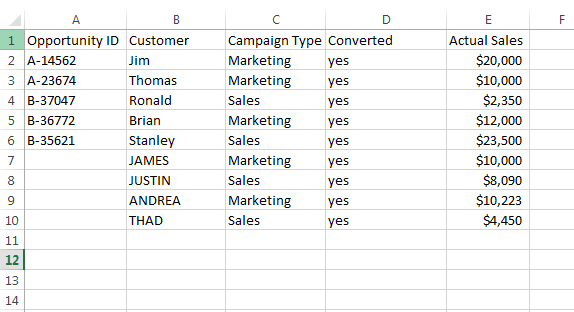
FIG2 – Table two (Leads$) shows a list of actual sales leads. Some are converted from an Opportunity (Identified by their Opportunity ID) and some are cold-call sales that were not a part of a specific sales campaign. Customers without Opportunity ID’s are capitalized only to highlight them for later.
Tableau
To build this visualization to requested specifications, we need to join the two tables while keeping all unique customers across both tables. Since some customers are not identified with an ‘Opportunity ID’ we need to run a FULL OUTER JOIN to get all rows from both tables.
Unfortunately, Excel does not support FULL JOIN, and Tableau does not support them for multiple table connections.
Let’s see what Tableau and Excel can do with the native connection features:
The following image shows the result of two data connections with a Tableau data blend on the ‘Customer’ dimension. First thing to notice is that any of the customers unique to the Leads table (those without an Opportunity ID) are not being shown at all. In effect, the data blend is requesting a LEFT JOIN on the tables, leaving out the unique customers from Leads.
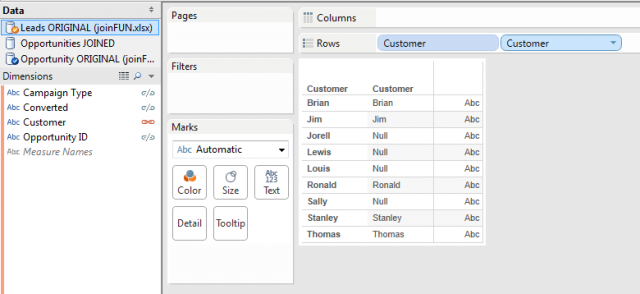
FIG3-Separate data connections to both tables and then blended on the Customer field.
We can attempt another connection using Tableau’s multiple-table data connection. A multiple-table connection joined in Tableau also does not print out all thirteen rows of Customers.
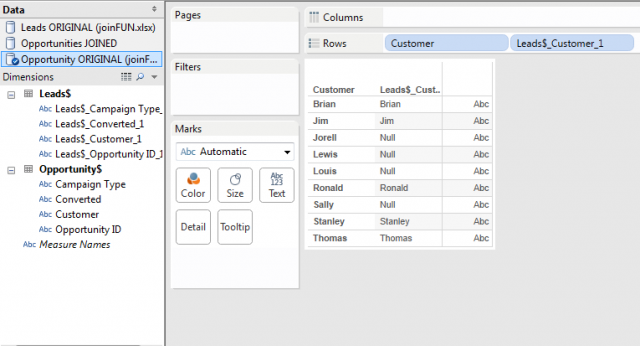
FIG4 – Multiple table data connection with a LEFT JOIN.
Neither of these connections give us the result we need. Excel doesn’t allow FULL OUTER JOIN and Tableau is restricted to LEFT, RIGHT, or INNNER. How are we going to get both tables correctly into our viz (without exporting to a different database that supports OUTER JOIN)?
The solution is to run a UNION of both a LEFT and RIGHT JOIN on the first table (‘Opportunity$’ in this case). The following SQL statement joins both tables on the column ‘Opportunity ID’.
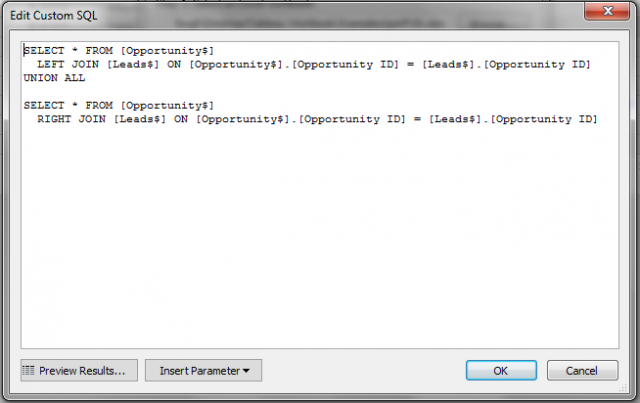
FIG5 – Custom SQL script to imitate a FULL OUTER JOIN.
In the above SQL statement, I opted to substitute Tableau’s default behavior to set aliases for all table columns for the wildcard. This is a personal choice, for the un-aliased headers actually make it easier to distinguish which table they are from. Additionally, when we create calculated fields to visually join the dimensions, we can create simpler and unique aliases.
Now that we have both tables fully joined in Tableau, we can see the improved visualization. But first, let’s see how the distinct dimensions from each table behave in the worksheet.
Bringing the ‘Lead$.Customer’ and the ‘Opportunity$.Customer’ dimensions both out onto the rows shelf, we can see that they, individually, are both behaving separately and listing nulls instead of pulling the data from the other table. However, we have made progress. We now get the full thirteen rows joined from both tables.
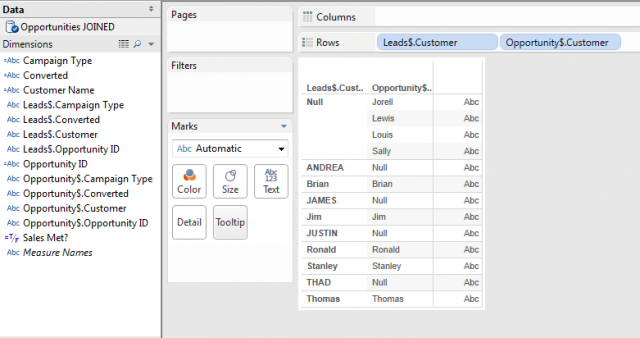
FIG6 – Single custom data connection with both Customer fields from each table on the rows shelf. Tableau is listing all customers, but still showing nulls and not displaying all results in one column.
To complete the Tableau join of the data tables, we need to create calculated fields to visually combine the ‘Customer’ dimensions from each of the tables. Using the IFNULL (logical) function, we can tell Tableau to print the value of the opposite table if the value in the table is NULL.
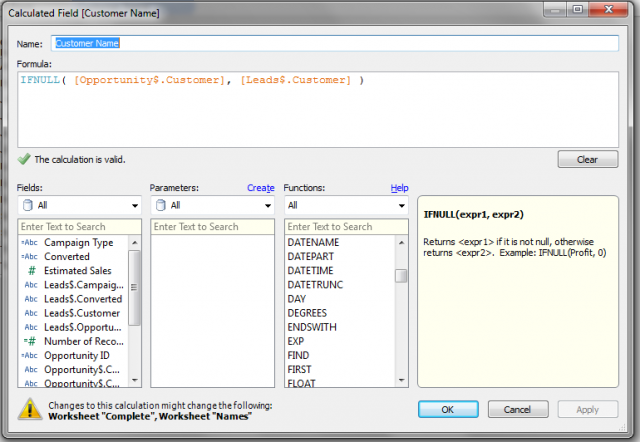
FIG7 – Calculated Field on ‘Customer’ to populate a single column with the correct Customer value.
The resulting Calculated Field will ‘stack’ the results of the ‘Customer’ dimension from both tables.
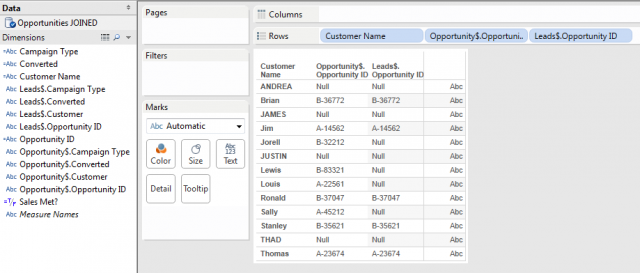
FIG8 – The resulting table shown with the original columns with NULL values against the new calculated field column.
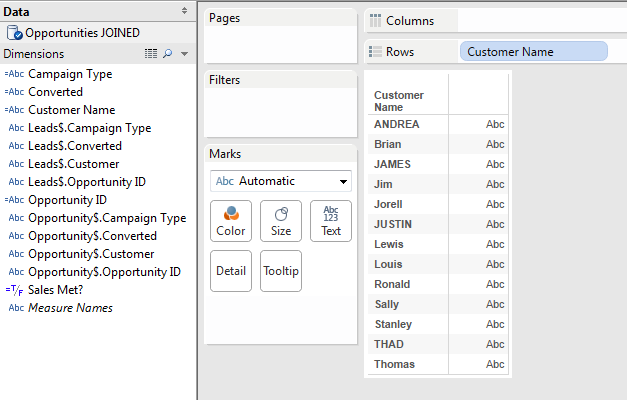
FIG9 – Remove the original, uncalculated dimensions and we get the result we wanted.
In order to get a similar result with the ‘Opportunity ID’ dimension, we have to adjust the Calculated Field formula just a bit. Notice in the original ‘Leads’ table, some Customers are not identified with an Opportunity ID. To account for this in the calculation to avoid printing ‘NULL’ in the viz, simply set the second expression in the IFNULL calculation to an empty string.
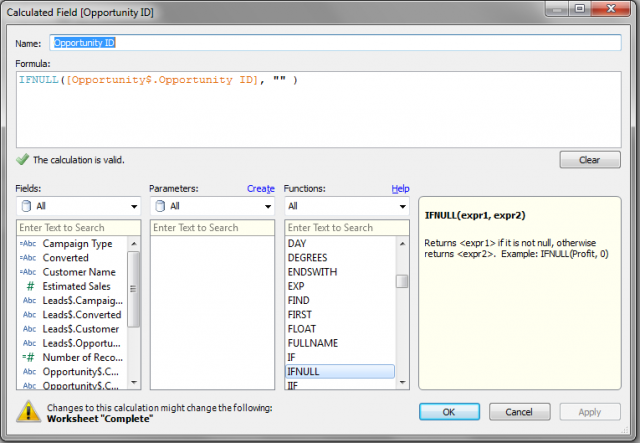
FIG10 – In order to hide the NULL values, run a similar calculated field on ‘Opportunity ID’ and leave the second expression as an empty string. Then drag the new ‘Opportunity ID’ dimension to the rows shelf.
Now drop the new ‘Opportunity ID’ calculated field onto the worksheet (text area) and we see the result as intended. Customers that are not assigned an ‘Opportunity ID’ will simply have an empty cell instead of the word “null”.
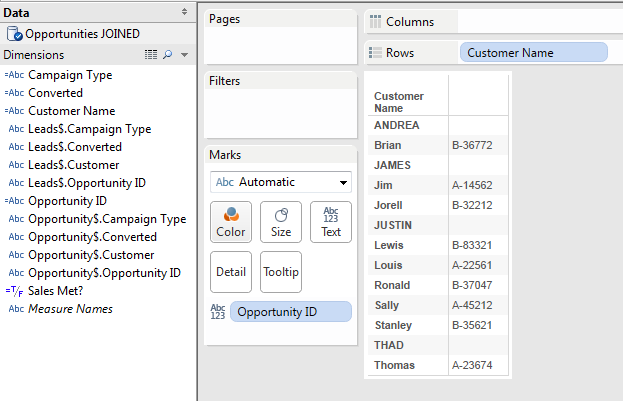
FIG11 – The result of the calculated field on ‘Opportunity ID’.
Following with the same method, we can create additional calculated fields to visually join the ‘Campaign Type’ and ‘Converted’ dimensions.
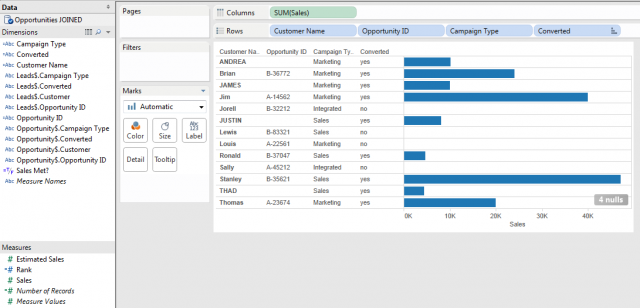
FIG12 – Add additional Calculated Fields for ‘Campaign Type’ and ‘Converted’ dimensions. ‘Actual Sales’ is added to the columns shelf.
At this point, we can now work with the dimensions and measures in Tableau very easily.
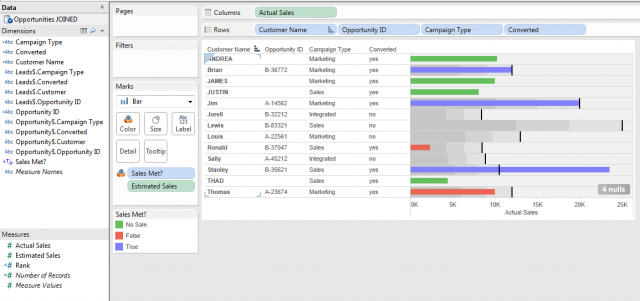
FIG13 – Using a bullet graph, the Actual Sales are shown against the Estimated Sales from the Opportunities table.