
The Tableau Performance Checklist series is designed to help you streamline your dashboard performance and Tableau Server configuration. Each post expands upon one item listed in the master Tableau Performance Checklist. As of 2024, you can find an updated Tableau Dashboard Performance Checklist here.
Let’s take a look at the next item on our rending category.
“Limit the use of detailed text tables with lots of marks.“
Ah yes, the fabled Text Table.
Mark Counts
Let’s start this discussion by reviewing mark counts. We covered this in the previous Rendering article in the Tableau Performance Checklist series, but it bears repeating. Marks are the individual data points on your chart. Depending on your visualization, these can appear as bars, plots, lines or text.
The way you can determine how many marks you have on your worksheet is to look at the bottom left-hand corner of Tableau Desktop.
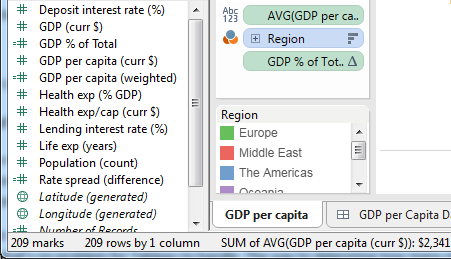
This particular example has 209 marks. That’s not a big number for Tableau, but these can grow quickly if you’re not careful.
Text Tables
Text tables, or cross tabs (or pivot tables in Microsoft Excel), can end up with a lot of marks. If you have six different columns across fifty rows of states, then you’re throwing up three hundred marks right off the bat. Most likely, your report consumer will miss the point of your viz unless you build in a ton of contextual help (and blinking arrows pointing at the particular cell of importance).
A visualization with a lot of marks is not only difficult to decipher, but it also takes more time to load. Depending on how many marks you’ve got and how hard it is for Tableau to get them out of your data source, that can make a noticeable impact on your worksheet’s performance. Let’s assume that each of these entries averages six characters ($xxx,xxx.xx), then the number of items that Tableau must produce just for the data marks for this text table grows to 3,300. Holy schnikes!
That’s the double whammy – hard to use and slow to load.
Best Use of Text
There are very few instances when a text table is a better option than a more visual representation of the data. An easy substitution is the traditional bar graph, which easily compares performance across columns. Using other charts, you can create visualizations that are more easily interpreted and digested. You’ll have to decide on what is the most important aspect of the data you’re working with before choosing which chart will best capture the story of the data.
In addition, text tables are not all that interactive. That’s a big strength of Tableau Software. Nothing builds understanding like letting someone jump in and click around.
When you can avoid text tables, do it. Use them as supplementary print handouts for the people that want the extra detail or for people who just have a whole bunch of extra time to go row by row.
In situations where a text table must be used, consider using dashboard actions so that they only show a relevant selection of data as opposed to the whole data source. My go-to is to utilize a combination of dashboard containers and filter actions to display a subset of text data only when the user goes out of their way for it. It’s a relatively easy process. Once you have your text table built out, add a layout container to your dashboard (horizontal or vertical, depending on how you want it to function). Add the text table and another sheet in your dashboard to the layout container, and remove the title from the text table. Then, add a filter action to your dashboard. It won’t matter if you choose hover, select or menu, but be sure to select Exclude all values under the Clearing the selection will: option. The end result looks like this in practice:
This helps to keep the mark count down and only shows relevant information once someone engages with the dashboard.
While every chart type has its place, the text table is perhaps one of the more over-used options. Excel users that transition to Tableau have a tendency to stay with the old tried and true. Be brave and jump into the other chart types. You’ll find that your report consumers will be grateful.
Mastering Best Practices
If you’re interested in becoming a Tableau Server guru, then learning these performance best practices is essential. Check back frequently as we add new posts and dive deeper into each point in the Tableau Performance Checklist.
Another great way to identify best practices is to leverage the insights offered by our Performance Analyzer, part of Workbook Tools for Tableau. It will examine all of your workbooks, worksheets, dashboards and data sources against a list of best practices to ensure that you’re using all the tips and tricks to guarantee your visualizations are moving at light speed.
As always, feel free to get in touch with us if you have any questions regarding performance or anything Tableau related! We’d be happy to help.