
10 Questions is an ongoing blog series in which Tableau Zen Master Dan Murray interviews some of the brightest folks in the world of data.
A couple of months ago I did a speech in Vancouver, BC, and had the good fortune of getting to have dinner with Kelly Martin (Tableau Zen Master) and another amazing Tableau expert: George Gorczynski. George has an outstanding Tableau blog called Tableau Picasso. The posts he does are intelligent and artistic.
The Questions
Q: You are a data visualization specialist. Is that how you make a living?
Gorczynski: Yes. My background is in civil engineering and hydrogeology, and I worked for most of my career in engineering consulting. In that line of work, you can spend a lot of time on construction sites and doing field investigations. Although I did a lot of that type of work, especially early on, I was always drawn to analyzing data, rather than collecting it.
I had plenty of opportunities (and need) to organize datasets, build databases, use CAD and GIS systems to prepare technical drawings and maps, and use illustration and design software to visually explain scientific and engineering concepts. In the last two years, I found myself involved in more and more business analysis projects and have turned to Tableau as my primary work tool.
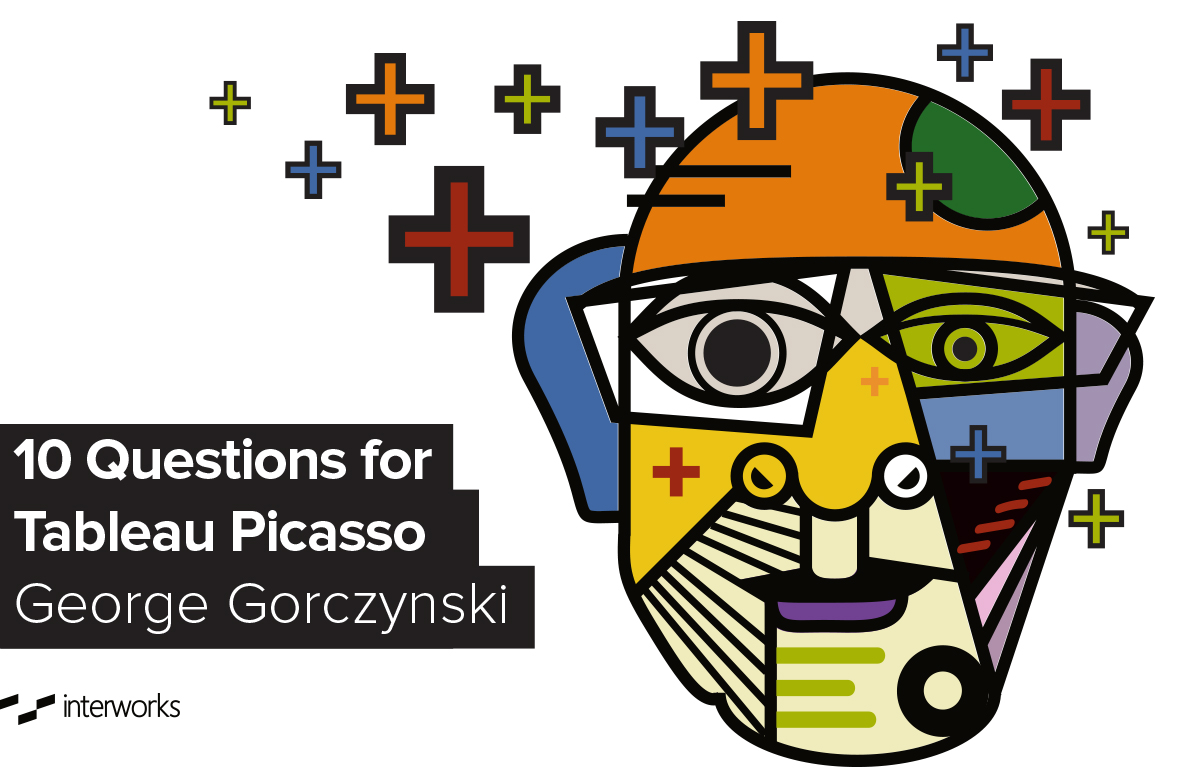
Q: I love your blog’s name, “Tableau Picasso.” How did you come up with that name?
Gorczynski: Audible similarity, I guess. I enjoy playing with words and inventing descriptive phrases and nicknames. I was talking with my wife one day about art, and when I mentioned Pablo Picasso, it struck me how much Pablo sounds like Tableau, which was on my mind a lot at the time.
Considering the power Tableau has to turn data into works of art, I thought it would be a good name for a blog, which I was thinking of starting. People often comment on how much they like the name, which is great!
Q: What are your goals related to your blog?
Gorczynski: At the most basic level, I want to post more often and share more of my ideas. It’s so easy to start a blog and so hard to post frequently and maintain the quality of your content.
My blog is not very technical, and my objective is not to write about advanced Tableau tips, complex table calculations or undiscovered features. There are so many people in the Tableau community who fill that niche with their amazing knowledge, insight and passion to share their findings with others.
I aim for my blog to have a truly graphics-oriented angle, feature visually pleasing work and novel uses of Tableau. I would like visitors to my blog to leave thinking, “I didn’t know you could do that with Tableau, and the results look really cool!”
Q: How did you discover Tableau?
Gorczynski: I must have been searching online for a solution to one of my data viz headaches and came across Tableau. At first, I didn’t think it would be of much use to me on my engineering projects. But, after I installed a trial and played with Tableau for a day, the idea light bulbs started popping up.
I talked to a few people in the office to find an applicable project; I guess I started looking for problems for Tableau to solve. My first project was related to mining. We were collecting data on concentrations of metal contaminants in tissues of animals living in the vicinity of a coal mine. I used Tableau to catalog these data and output concentration distributions for client reports.
The interactive nature of Tableau made the process of reviewing data and providing quick report updates much faster than before. Not to mention that the final product looked better than anything any other tool could produce.
Q: How do you get ideas for your blog posts?
Gorczynski: When I read about an issue that interests me or come across an interesting data set, I think how it could be presented in Tableau in an original way. I draw my inspiration from non-Tableau graphics books, magazines and online articles.
I have plenty of muses in the Tableau community, but I would be remiss if I didn’t mention two Zen Masters whose work I admire the most when it comes to visual aesthetics: Kelly Martin (a fellow Vancouverite) and Ramon Martinez. I think their work consistently illustrates what a great Tableau viz looks like.
Q: Your Viz Art entry was really cool. How did you get the idea for the Lorenz Attractor?
Gorczynski: I have long standing interests in chaos theory, generative art and emergent behavior. I have always been fascinated with simple mathematical formulas that can produce complex, organic and often unpredictable shapes.
A decade or so ago, I used Flash and ActionScript, and later Processing, to play with simulating natural processes on a computer. The Lorenz Attractor was one of my old ActionScript programs that I adapted to Tableau’s environment. I tip my hat here to the amazing Noah Salvaterra who has definitely pushed the limits of Tableau with his visualizations of L-Systems, fractals and 3D shapes.
Q: What do you hope to see in future releases of Tableau Desktop?
Gorczynski: There are so many great ideas floating around in the Tableau Community wish list, but one appeals to me in particular because of my education and work background. I would love to see new features that truly make Tableau the tool of choice for visualizing engineering and scientific data.
Ken Black, a fellow hydrogeologist and Tableau super user, refers to the result of adding such features as “Scientific Tableau.” For example, a powerful scripting language built into Tableau would give users the ability to customize and build on the software’s existing functionality, taking it to a whole new level and potentially expanding Tableau’s customer base significantly.
At its core, Tableau is so great because it’s easy for almost anyone to pick up and work with out of the box, but I think adding custom scripting would open up so many new possibilities. Just look at what VBA did for MS Office and ArcGIS or the tens of thousands of custom scripts written by users in AutoLISP that expanded AutoCAD’s functionality.
Q: What do you see happening as the amount of data grows? How do you think small and medium-sized businesses will capitalize on Big Data?
Gorczynski: I think there will be more and more pressure on these companies to become data-driven organizations. Those who don’t invest in agile data analytics solutions will be flying blind and will be left behind.
Many small and medium-sized businesses are still at a point where they require fundamental cultural shifts away from decision making based mostly on insights derived from Excel spreadsheets and management’s gut feeling.
There are huge opportunities to make better decisions faster if all units of a business work together, share data and agree on common reporting platforms. Issues with communication between business units are a common challenge in organizations, and the above requires a great deal of work, but it can be done.
Q: You have technical degrees from Cracow University of Technology in Poland and The University of British Columbia. How has your technical background helped your Tableau visualization and dashboard building?
Gorczynski: My formal technical education has been a huge asset throughout my career, and I always try to be mindful of that. As time goes by, and you gain work experience and experiment with different passions, it’s easy to underestimate and forget about the importance of the foundation that is built during your early years at university.
My technical education taught me how to quantify the world around us. It helped me develop a fascination with how math describes and explains natural phenomena, whether it be groundwater flow, weather patterns or self-organization and pattern creation in nature. This schooling also taught me critical thinking and research skills which are so important in data analysis.
That said, along the way, I complemented these skills with studies in 3D animation at Vancouver Film School and took many photography courses which sharpened my creative eye and ability to communicate ideas visually.
Q: What advice would you give a young person that wants to get into doing data visualization and data analysis for a living?
Gorczynski: I learned a long time ago that we can only be truly successful doing what we are really passionate about. It doesn’t matter what the new career trend is being hyped up in the media, what jobs pay the most or what other people say you should be doing.
Do some soul searching, ask yourself and honestly answer: Do you like working with numbers? Do you like math? Are you detail-oriented? Are you intrinsically curious? Are you creative? If you answered “Yes” to most of these questions, then you have a solid foundation to become successful in the field of data analysis and visualization.
There are plenty of data analysis, statistics and programming courses available online for free or at low cost. Check out Coursera, edX and Udacity to name just a few. Learn as much as you can. Study data visualization fundamentals from books by Stephen Few, Edward Tufte and other authors.
Download Tableau Public and start visualizing data; you can find plenty of exciting data sets available online. Follow Tableau, data analysis and visualization blogs, and learn from the experience and expertise of established professionals. There is no shortage of wonderful knowledge out there just waiting for you to dive in and absorb.
Good luck, and have fun!
Discover More Interviews
Want to read more insightful interviews like this one? Then you’ll love our 10 Questions blog series. Check out the full list of interviews here, and stay tuned for new additions.
Need Help? Let Us Know!
There you have it. If you need help with your data infrastructure or Tableau, we have the experience, skill, and knowledge to insure your success. Contact us today to learn more.
If you’re in college and think you might want to get into this game, head to our Careers page and apply for one of our open jobs. We’d love to hear from you.