

The volume, velocity and variety of data (Big Data) has been beaten to death over the last few years. I think it’s a silly metaphor. Why? How many of you have “run out” of storage recently? Has your company told you that you can’t have any more data because they don’t have space left to store it?
People responsible for administering your data have solved the volume and velocity problems. Sure, if you work in Silicon Valley, the velocity problem presents challenges, but those challenges are being solved every day. The biggest problem in Big Data is variety.
Traditional stack vendors aren’t very good at addressing the variety problem because their fundamental design is based on the “single version of the truth” principle, which is a nice idea. It’s a bit like chasing the pot of gold at the end of a rainbow; it’s motivating to think about the potential, but it’s never fully achieved.
Modern Reality
The data environment today is defined by increasing variety of data products. I’ve tried to count all of the data products available today and gave up at around 200. I’m sure that there are many more than that. The point is that we live in a time where only a small subset of useful data will be tucked neatly behind your firewall in a dutifully cleaned and monitored data source. If you limit your use of data sources to the ones your IT group blesses, you’re missing potential opportunities to blend your internally validated data with external sources that might yield useful and actionable insights.
Take advantage of the plethora of high-quality data that’s available via the web by updating your data strategy to encourage self-service exploration by your user base via easy-to-use and visual data exploration, analysis and reporting tools. Don’t assume that your most experienced people will just “pick up” the user-simple tools. They won’t. Get them training. Finally, admit you won’t be able to control all data used in your business (you don’t now – remember the spread-mart). Be ready to take advantage of new technology to proactively monitor and manage the unstructured data sources that your user base is already employing to make better decisions.
The modern data strategy requires the right tools, timely training and new technology/strategies.
Data Visualization – The Right Tool
How does one understand millions of rows of data on a computer screen? Data visualization is the best way to quickly identify trends and outliers in your data. Tools that lower the technical hurdle and leverage the technical chops of a database expert for a much wider audience of analysts and business users are not a luxury – they are an imperative.
Tableau Software’s remarkable growth over the past few years is a testament to good design and the validity of my point of view. Giving end users an accessible tool that visualizes data in effective ways is a crucial element of a modern data strategy. I would say that it is the most important element because it frees the data from the database so that your frontline staff and managers can know what’s important sooner with appropriate visualizations that help them see and understand what “the data” is saying.
Tableau is easy to learn, easy to use, scales well and has proven itself over the past few years. They have a very enthusiastic user base for a reason: The software provides real value in a wide variety of use cases.
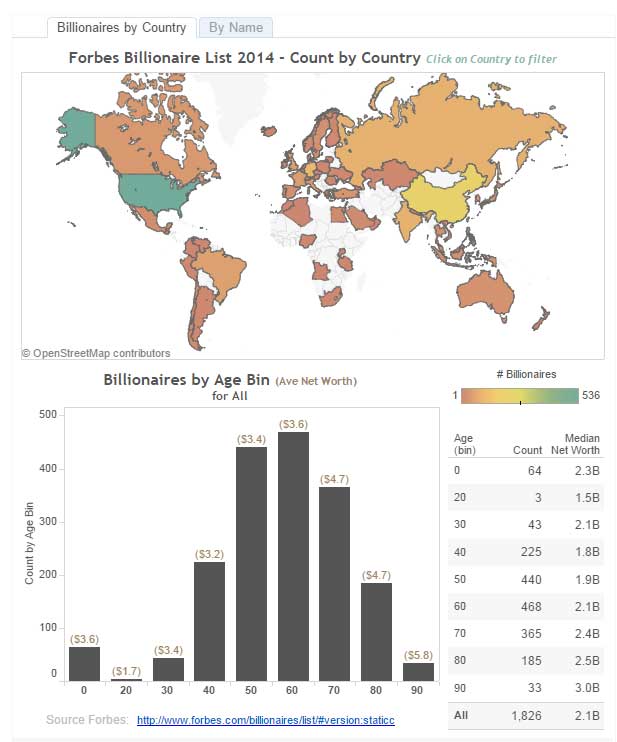
Above: A simple viz made in Tableau.
Effective Deployment Starts with Training
Don’t assume that because the tool is so easy to use, your technical people and analysts will pick it up immediately and use it effectively. What I find is that the most experienced data people build the worst dashboards and visualizations using Tableau. This happens because people tend to build what’s familiar. Generally, the familiar is not good.
Several problems happen in major deployments when training is skipped. Dashboard quality is poor. Performance suffers (initial load speed and query speed). Adoption is less than it should be because the initial results look a lot like the old dashboards that, typically, aren’t very good.
You will avoid all of these issues if you train your deployment team. That team should include database experts, analysts and end users. If your database experts understand how Tableau works, they will be able to architect schema that will optimize speed and provide the right data for the analysts to play with. If a few end users attend (I recommend bosses), they will get an appreciation for the difference between good and bad dashboards, effective visualizations and what is possible.
Provide Expert Support
It’s also important for the IT/BI experts to provide a framework that enables less-technical end users to get help when they need it from knowledgeable experts. To do this, establish a Help Desk that provides rapid response to questions. By rapid, I mean immediate to under one hour. Staff this function with people that understand the database schema and Tableau. Rotate the responsibility; measure and report on the team’s response times. Admit substandard performance, and make adjustments over time.
The best way to build bridges is to help your end users with knowledgeable expert assistance that is timely and encouraging.
Employ New Technology (and Strategies) to Govern the Data
Tableau Server provides a very good data governance model for your structured data. It is flexible and gives you the ability to utilize existing security models (active directory, Kerberos, reporting portals) to protect and govern your data. But, by allowing people to build their own visualizations and dashboards with a tool like Tableau, there is an element of risk. What if your users do the wrong thing, make improper joins or misinterpret the data? What if they accidentally expose sensitive information? These are valid concerns. Your governance policies need to adapt because the genie has been out of the bottle for a while.
Shift Mindsets
A few years ago, a BI professional at a major retailer told me he didn’t care about how his data was being used. This was a first for me. I asked him why. He pulled out a legal-looking document that every person using Tableau had to sign. This document said (I paraphrase): You are responsible for what you create. It said it in very legal-sounding and expansive words. But the message was this:
“The IT/BI team certifies that the data we provide you is complete and accurate. Any data you join with our data is your responsibility. We are not accountable for what you do with our data, for new data you bring in that isn’t certified or the methods you use to validate the data.”
This policy recognizes reality. IT can’t be responsible for everything the user base does when data access is granted to a wide number of users. It places responsibility where it belongs — with the creator. It’s sensitive to the business need for quick turnaround and access by giving the users tools that make their jobs easier, providing access to the data but clearly enumerating accountability and ownership.
Make Use of Data-Aware Storage
You can deploy Tableau, train your users and restructure your team to make better use of the structured data that resides in your systems; however, what can you do to monitor the unstructured data that your analysts and information consumers are introducing in dashboards and visualizations? This is the big challenge.
There is new technology that I think of as “data-aware” storage. Most large companies deploy some kind of centralized storage hardware. The problem with this hardware is that it’s stupid. It doesn’t really know what people are storing on it. We’ve been testing a new technology, the Discovery Series, from a company called DataGravity, and it’s exciting.
DataGravity has created the first data-aware storage platform. Think Network Attached Storage (NAS) that is data-aware. DataGravity’s technology is able to probe the contents of the files that your user base is storing on the NAS and give the data administrator warnings about the presence of sensitive information (social security numbers, web addresses, etc.), who created the data, who has accessed what data and how often that data has been accessed.
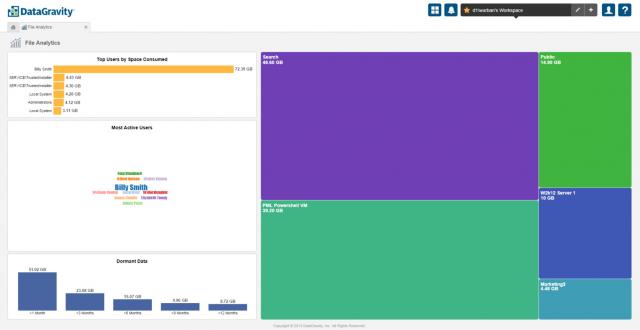
Above: The DataGravity Discovery Series provides unprecedented insight into storage usage.
This is an exciting technology because it provides a means for IT/BI to monitor the unstructured data that the business is using to create visualizations and dashboards that isn’t part of your data warehouse-certified data. It has the potential to provide an intelligent early warning system that alerts IT about the lineage of potentially harmful data breaches. But what about data that resides on laptops outside of the NAS?
An Effective Data Syncing Policy
If you deploy Tableau Desktop to many different users (and you should), this does introduce new risk. However, you can mitigate this risk with the strategies previously discussed and by introducing easy-to-use and secure data syncing technology. We have clients that have thousands of people creating data, building dashboards and sharing findings that are using laptops from remote locations that are outside of the firewall.
Make it easy for remote workers to sync their data to the NAS by making it very easy for them to comply with your data governance policy. Set up a secure syncing system that automatically transfers new files to the NAS every time they connect to the internet. This system should happen in background. The only requirement should be that when the user creates something new, they store it in a specific folder on their computer that is auto-synced.
The Modern Data Strategy
Data governance is important but so is data access. Train your users and set up effective policy, provide expert assistance at a speed your user base will appreciate. Also, deploy new technology that will alert you to the potential of serious data breaches before they happen.
Bring in the Experts!
InterWorks has experience and knowledge in all these areas. If you want help in designing effective policy, training or deploying the technologies mentioned in this post, contact us.
The Latest
-
Kickstarting Data Innovation in Healthcare
18 April, 2024