
Hello from 25,000ft! Today I’m en route to Louisville, Kentucky, but yesterday I had a blast running the Warrior Dash along with 15-20 of the InterWorks crew. We all had a great time in the mud, and while we’re not necessarily out to win, everyone inevitably wonders how they stacked up, so here’s a quick Tableau analysis!
First things first – we need some data. I navigated to the results page on the Warrior Dash website and found this nice table of data:
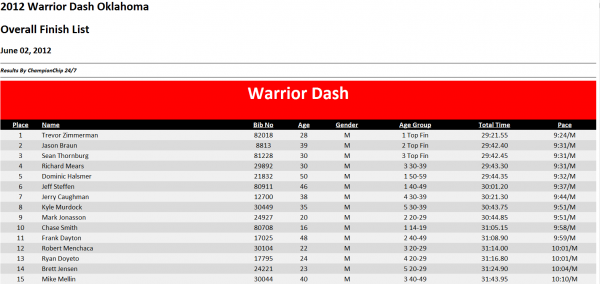
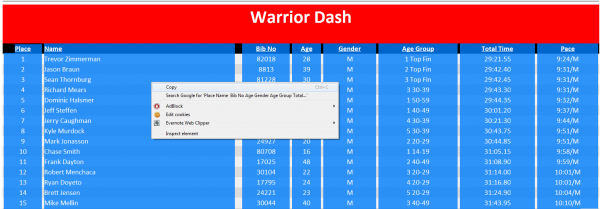
Very nice – so I decided to use Tableau’s build in support for copy and paste. I highlighted the table, right clicked, and copied the data to my clipboard.
Then I opened Tableau and hit Cntrl+V to paste in the data – and I’ve instantly imported all the race results as data!

I dug through our planning emails and found a table of participants, their departments, and office locations. Perfect! Another highlight, copy, and paste later, I have that data in Tableau as well!
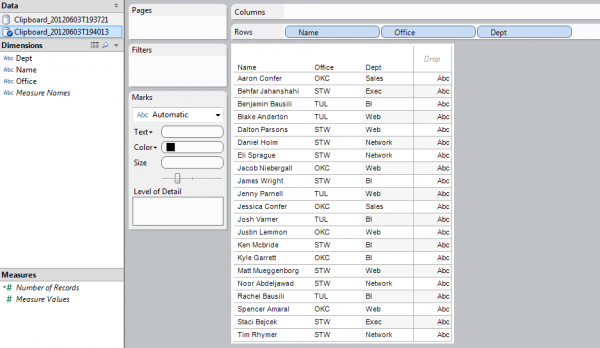
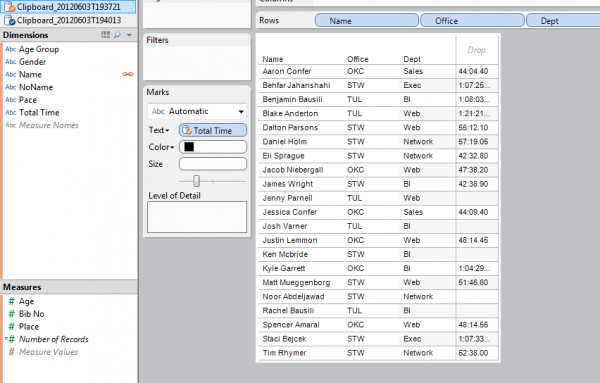
So far so good, now I want to display race results for each of our employees, and since both name fields are called “Name”, Tableau can automatically blend the data together for me. I took the view above, simply clicked over to my other data source, and dragged on the “Total Time” field from the official Warrior Dash results. As you can see, I’m using the primary data source (a table in our emails) blended with the Warrior Dash results (as a secondary data source) to show results for each member. Note the empty cells – turns out we had a few folks unable to make it at the last minute, so Tableau gracefully handles the nulls in the blend.
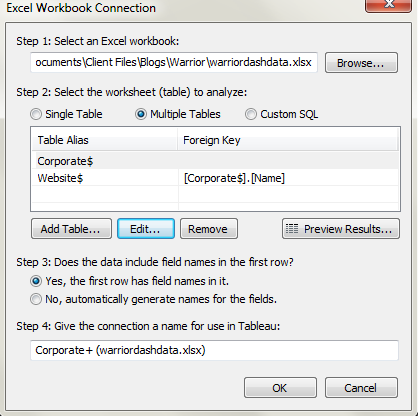
Even this 2 minute use of Tableau really beats the endless finding we’d have to do on the results page to find all our runners. BUT, since we’ve got more dimensions in both data sources not found in the other (Department and Location are in our email, but not the website, and Age Group and Gender are on the website, but not our email), I’d like to go a little further than blending can get me (remember, blending is only effective when there is a shared level of dimension between two data sources).
No problem. I pasted the Website data into one excel sheet and our email data into another. I then dragged that Excel document into Tableau; and Inner Join on Name later, I’m in business.
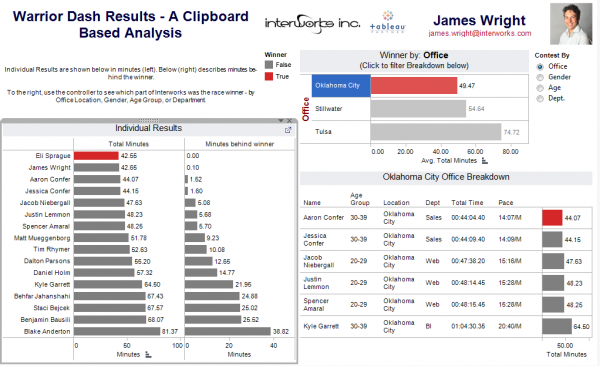
I decided to put together a dashboard where you can see individual results for all our runners, and then break down those runners by all the dimensions I found in our two data sources – so you can see whether our Tableau team beat our Networking team (they didn’t), or Stillwater was the fastest office location (it wasn’t).
You can see the results below, and in the attached TWBX file.
To see photos of the InterWorks Warrior Dash Team in action, visit the Warrior Dash! photo album on our Facebook page.