
“Data for data’s sake is a path to disaster”
As is so often the case, various colleagues, friends and random members of the data culture offer up ideas regarding the use of Tableau, data and design. Sure, some of these “Huh, I wonder if I can do that?” questions should stay that way; but, the good ones, well, we can’t leave those alone.
By using SQLite, Tableau 8 and some smart design, we will manage to split what would be a huge TDE into smaller, faster TDEs in order to leverage your data in a way that makes some intuitive sense to your project and/or business.
If you haven’t experimented with SQLite yet, I’d encourage you to do so by visiting: http://sqlite.org/. According to their site, “SQLite is the most widely deployed SQL database engine in the world. The source code for SQLite is in the public domain.”
Cool. Now let’s move on. If you don’t want to mess with it, just follow along, and we’ll post the Tableau 8 workbook at the end. If you do have SQLite installed, run the SQL script (also attached):
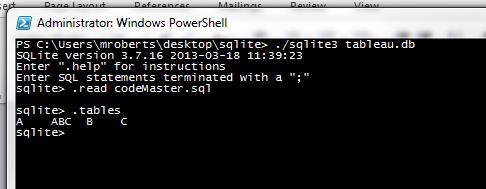
Open Tableau 8 and connect to the table ABC (note: before you connect to the SQLite data source, you’ll have to install the SQLite driver). Excellent instructions/details can be found here: http://kb.tableausoftware.com/articles/knowledgebase/customizing-odbc-connections

Once you have connected, create an extract and label it something you will remember. This will serve as our “Base” table for what comes next. I know you’re excited … trust us it will be fun.
Now that the dirty work is done, we can use the 83 million row SuperStore TDE created by my colleague, Brian Bickell. We’ll use this as the “Hey – it’s taking too long to complete this extract on server” test case.
Oh, wait, let’s back up here. Why are we doing this?
Here’s the question: how do I work with data, all of my data, in a way that makes the extracts faster than creating one huge TDE?
The first step (decidedly the most important step) is to figure out how you’d like to split the larger TDE. Date? Segment? Region? Please (did we say please?) ensure that the solution scales and is relevant to the task at hand. As a good friend once said, “If an analyst is just now starting to look at data from two years ago, they should seriously consider a new job.” I cleaned up most of the language from that quote … you’re welcome. For example, any date field would be a great way to partition your data. Thankfully, it’s easy to split dates (I know what you’re thinking – it’s not that kind of date).
Opening up the attached twbx file you will see that we’ve split the larger TDE into two smaller TDEs based on YEAR (thanks version 8). If you want to experiment, we’ve also attached the original ZIP of the 83 million SuperStore TDE.
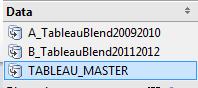
You’ll notice the “TABLEAU_MASTER” data source was the one we created with SQLite. It represents the way in which we’re going to get a seamless blend along each data source. If we used either of the smaller datasets, we wouldn’t get the complete picture and, guaranteed, we would be lost in PRIMARY vs. SECONDARY land very quickly.
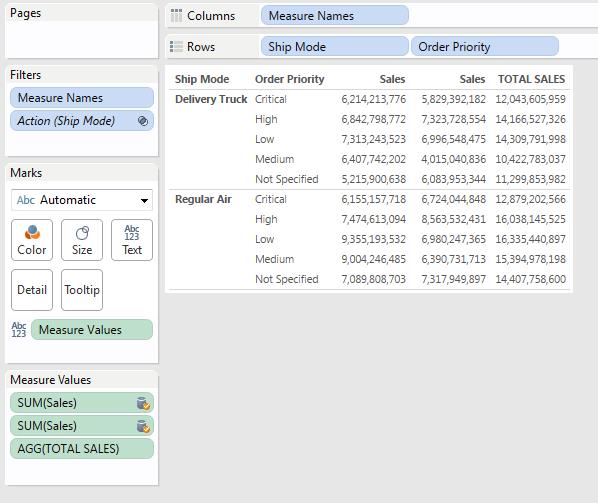
We’ve also picked the dimensions to analyze in our “TABLEAU_MASTER” source. For the blend to work, we needed the “skeleton” of all the dimensions which had to include every dimension’s attributes (Note: in a future version, we’ll show you how to use Tableau 8’s new “Custom SQL with Parameters” to add even more dimensions dynamically). Refer to the “Line” view for the use case. If we just used one of the smaller data sources, we’d have incomplete data. If we wanted to get a complete picture (2009-2012), there would be no way to do that if we started with data source “A” as our primary because it only has two years of the data; the other set of data is in data source “B.” In the end, we made the base table to union all of the other (smaller) TDEs together. As luck would have it, that data source actually has every year in it. Keep in mind, it matters less when one is not dealing with time and, instead, simply dealing with time-less dimensions info (see “Profit” view for an example).
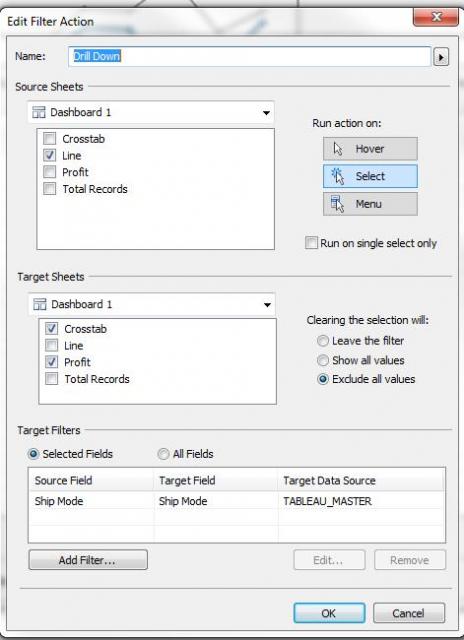
In the end, all things lead to the dashboard and with it, comes the power and elegance of Tableau. We’re going to combine our disparate TDE files into one seamless dashboard. This is where you could use an individual TDE or the combined versions; with the dashboard, it doesn’t matter because we’ve set up actions (see screenshot) and filters to make the dashboard more responsive.
Some final words …
With Tableau 8, we’ve seen some improvements in both data blending and compression of TDE files. Side note: I tested each extract in both version 7 and version 8 and the v8 TDE files were about 30% smaller than v7!
What’s more, the dashboard experience is much better now that we can choose between “Tiled” and “Floating.” It makes the experience, and visual aspect of the data truly stand out. Now, these improvements still demand excellent design skills and a feel for what data should and should not be part of the analysis. Sure, there are plenty of ways to look at a particular dataset, but always ask the following question: why is this important?
As always, don’t hesitate to reach out to us. We love hearing from you!
-Mike