The days are getting longer. The weather is getting warmer. The ice is beginning to thaw. You know what this means? The greatest time of year is right around the corner!
Summer time is almost here, and with it comes baseball season! To commemorate my favorite time of year and my second favorite sport (sorry, but hockey is just too good to not be number one), I wanted to create another scheduling dashboard. For those who have seen my NHL dashboard, you’ll notice some similarities, but I wanted to play around with the layout a bit.
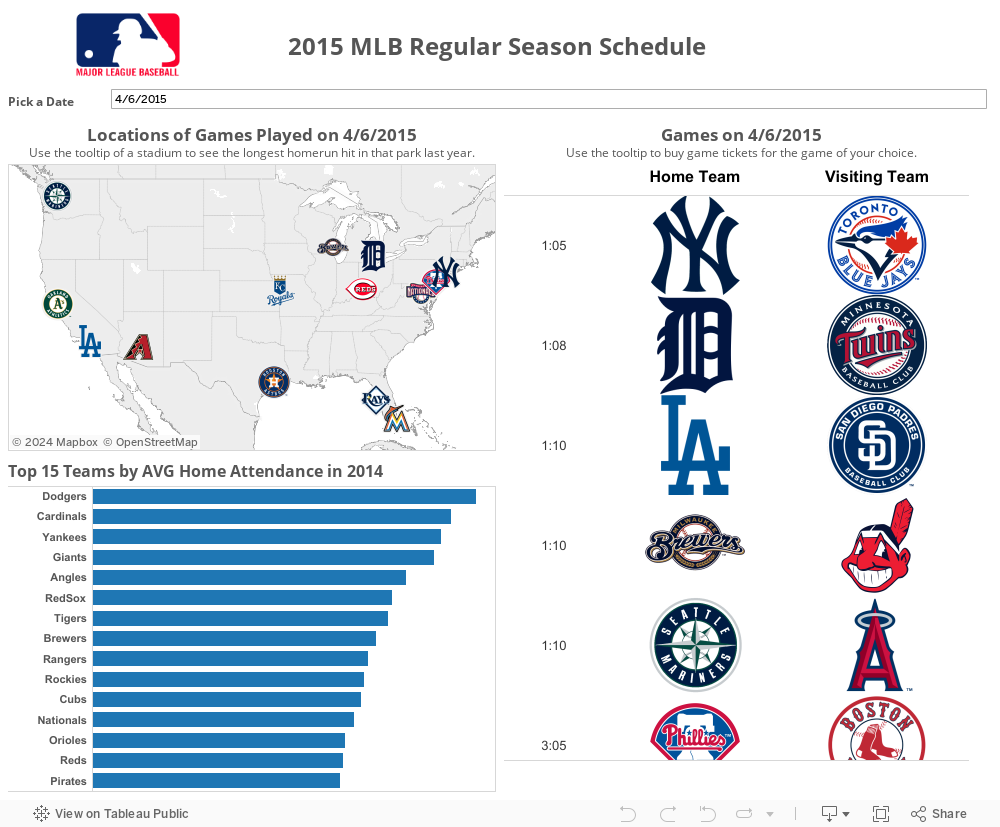
You will notice that, again, there is a map of stadiums and a list of all the games being played on a particular day. Nothing too new here. What is new is the idea of attendance by stadium. During this past hockey season, I noticed that some arenas had better crowds than others. So, I wanted to see which major league stadiums had the best attendance last year. Perhaps I can then better prepare for disappointment (I’m looking at you, Carolina Hurricanes).
Also, there is a fun little bit. If you’re a fan of monster home runs, you’ll be pleased to know that every logo on the map has a link embedded to show the longest home run hit in that ballpark in 2014. May I suggest checking out Kauffman Stadium in Kansas City for a monster blast by AL reigning MVP Mike Trout (last year’s longest HR)? Or, perhaps you could look at the where the Phillies play, Citizens Bank Park, where Giancarlo Stanton absolutely crushed one.
If you are a baseball fan and a frequent traveler like myself, I hope you can find this dashboard useful in being able to enjoy a few ball games during your travels. If you’re not, well, I hope you at least enjoyed watching some dudes crush baseballs!