There are people living in America today who did not have electricity in their home growing up. It cannot be overstated how much the power industry has changed since then. To understand and communicate those shifts, we turn to data. Some have done an outstanding job visualizing this information, particularly this map by NPR. Others could improve greatly by applying best practices to their visualizations. In this post, we’ll discuss one such example from the Energy Information Administration.
The Keepers of Power Data
The EIA is a government agency that collects industry data, analyzes trends and publishes forecasts through regular reports and online exploratory tools. Their electricity data browser is particularly useful to display changes over time at many levels of detail. It starts at a very high level and prompts for other categories or pre-defined views the user may want to explore.
Geopolitical comparisons in the U.S. Energy Mapping System take the opposite approach, overwhelming the viewer with details on every power plant in the United States all at once. There are options to view just one state at a time, but these don’t link back to trend lines and don’t allow visual comparisons of each state.
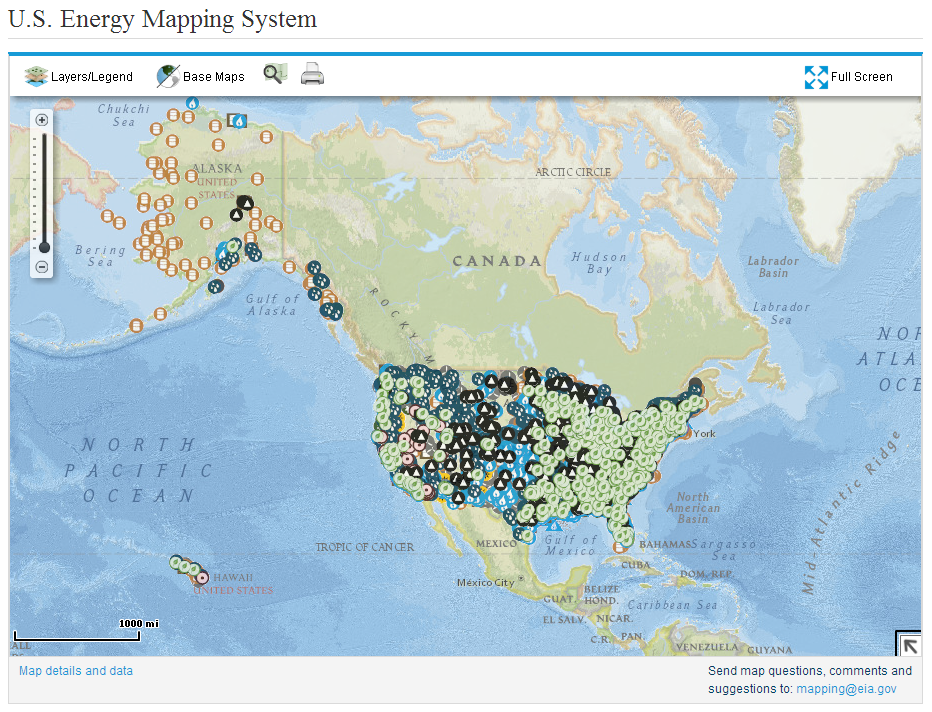
Visually speaking, this map doesn’t communicate anything useful. Here are the reasons why:
- The layering makes it look as if over half of the country is powered entirely by natural gas.
- The viewer cannot separate major power sources from those that seldom run.
- It can’t filter by state without going to another web page.
Viz Makeover with Tableau
How do we rectify this situation? The dashboard below combines the high-level trend data with a map showing state-by-state rollups. When an interesting point leads to further questions, a more detailed map and breakdown of fuel types is one click away.
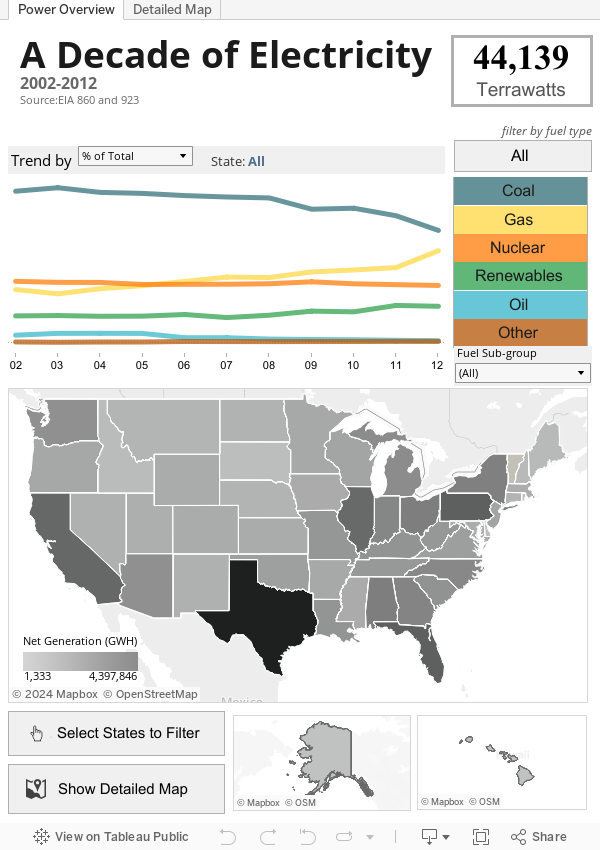
While I have experience in the utility industry, a few new insights stood out to me when exploring this dashboard:
- Behind hydroelectric and wind energy, wood-derived fuels rank third among renewable sources. Solar is near the bottom of the list.
- Florida tops the “Oil” and “Other” fuel categories. The state has also seen a sharp increase in power produced from natural gas.
- Illinois and Pennsylvania are heavily nuclear states. Pennsylvania has favored gas over coal in recent years while Illinois has remained steady across the board.
Further Insights
This analysis prompts deeper questions:
- How do they compare on a per-capita basis?
- What if we go further back in time?
- How would current projections of new plants and retirements change things in the future?
You can shed light on these and other questions by downloading this Tableau Public workbook as a starting point, then blending it with other data sets from eia.gov or elsewhere. If you’re unsure how to get started, I suggest following our current Tableau Essentials blog series or grabbing Dan Murray’s guidebook, “Tableau Your Data!” Then, share your insights or questions below in the Comments section.
The Latest
-

Kickstarting Data Innovation in Healthcare
18 April, 2024