
There are plenty of perks that come with being an InterWorks employee. You get to work with an awesome team, you get to work at some of the best possible clients and you’re surrounded by people who are genuinely interested in your personal and professional development. As a part of that last perk, you get to check out some really cool conferences like the Tableau Conference, the Sloan Sports Analytics Conference and, the one I’m attending, SXSW Interactive.
SXSW is huge, lasts for five days (not even counting the music festival afterwards) and features over a thousand sessions. This is going to be my first SXSW and only my second-ever conference, so I felt really overwhelmed trying to pick out sessions to attend. But this is InterWorks, and we get things done, so I built out a dashboard to make sense of it all.
How I Made It
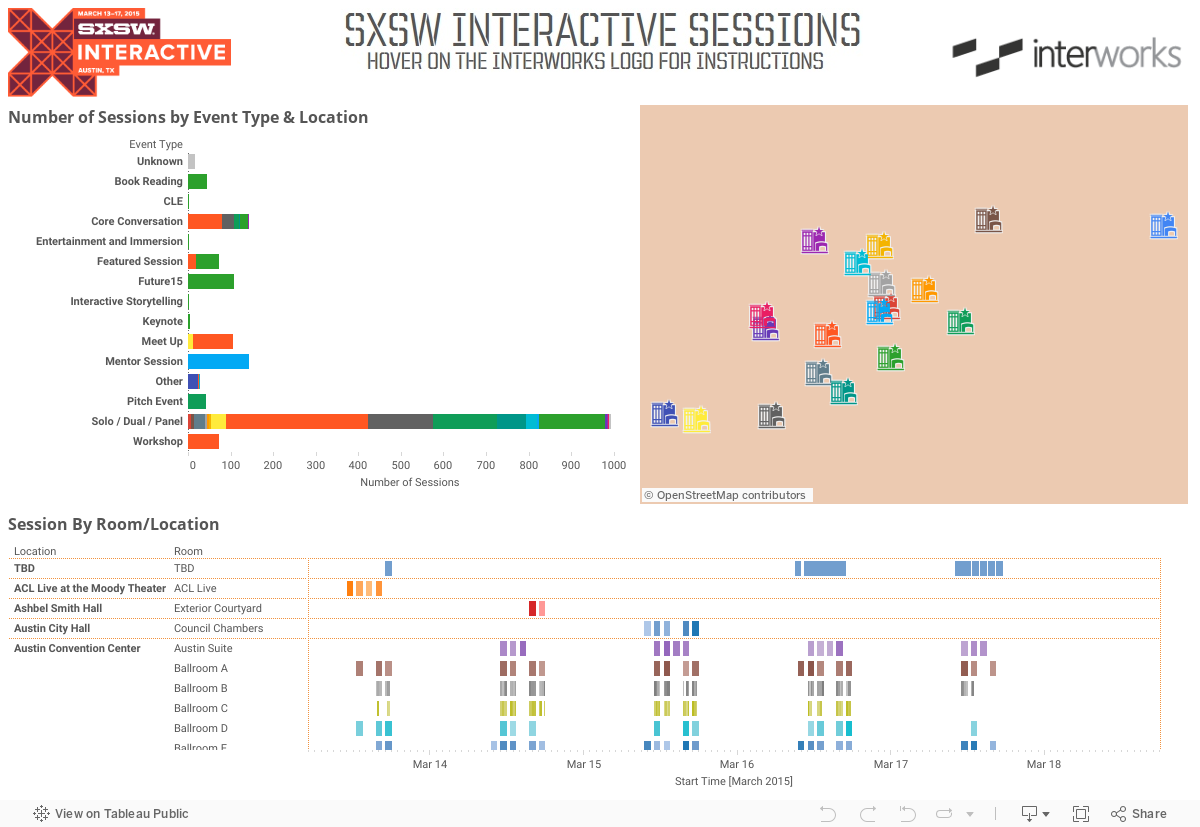
Using the incredibly user-friendly (and code free) import.io, I grabbed data on sessions from the SXSW website and put together some visualizations to help sort through the noise (sorry, Rand Paul, I won’t be making it to your talk at a tech conference) and get to the gold (the first presenter, sorted by last name alphabetically, is: A Lot, Sir Mix). The part of the dashboard that probably stands out the most at first glance is the map.
This is Stamen Design’s Watercolor map, and it is incredible. I have seven prints of different parts of it being delivered to my home as of this writing. I can’t recommend it enough. Incorporating it into your dashboards is actually fairly simple in Tableau 9. A special thanks to the very talented Allan Walker for putting these files together!
First, download the TMS file(s) that you’d like to use from here to your Tableau repository/mapsources folder. The next time you open up Tableau, open up a worksheet that uses a map. Pick the new map background you’d like to use by selecting Map > Background Maps. It will be blank, don’t panic! All you have to do now is go to Map > Map Options and check the boxes next to whichever map layers you’d like to use (there will often only be one).
Voila!
If you want to publish to Tableau Server using these maps, make sure the server also has the TMS file in its repository. If you want to make your own TMS files or publish them up to Tableau Public, you’ll need to follow the directions in this KB article. It involves editing the Workbook XML, but I promise you, I know very little code, and it’s really just using Ctrl + F and pasting in the right values, so I’m sure you can do it, too.