
Tableau Deep Dives are a loose collection of mini-series designed to give you an in-depth look into various features of Tableau Software.
The idea behind a Deep Dive article series is to spend far more time and energy on mastering a topic than what would be possible inside a traditional learning environment. We’re going to dig really deep into sets over multiple articles with real world use cases and examples.
Here’s our article schedule:
- Part 1: Introduction to Sets
- Part 2: Constant Sets
- Part 3: Computed Sets
- Part 4: Membership (In/Out)
- Part 5: Combined Sets
- Part 6: Calculated Fields
- Part 7: Hierarchies
We’ll start our deep dive with a quick overview of sets.
What are Sets?
Sets are custom fields that are created within Tableau Desktop based on dimensions from your data source. They are subsets of your data, which can be created manually (see article #2) or computed (see article #3). Either dimensions or measures can be used to determine what is included or excluded from a set using conditional logic.
There are numerous use cases for sets (courtesy of my InterWorks colleague Katie Fontenot). Some of these use cases include highlighting data that meets certain criteria, examining manually selected members of a dimension, comparing and contrasting members in the set vs. those that are not (IN/OUT), creating combined sets and much more. For instance, I could create a set of geographies that have been deemed strategically important to my business or another set that focuses on the least profitable products.
Within Tableau, the icon for sets is represented by a small Venn diagram (two interlocking rings):

Like parameters, sets also get their own section in the Data pane:
As well as being saved inside of your workbook, sets are also included in Tableau data sources (*.tds files), Tableau data extracts (*.tde files) and packaged Tableau data sources (*.tdsx). Now that we have a fundamental understanding, let’s compare and contrast sets to two similar features in Tableau Desktop – groups and filters.
Sets vs. Groups
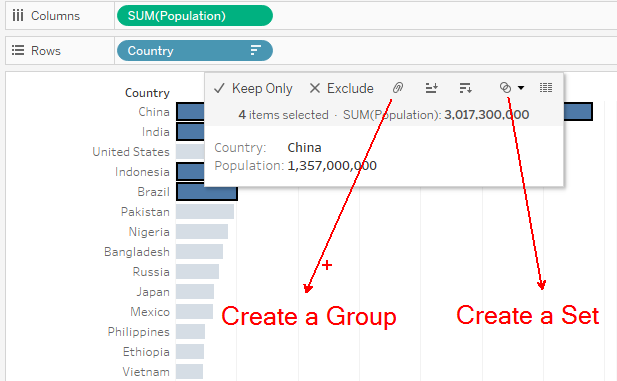
At first glance, sets and groups might seem very similar. For instance, let’s say that I want to analyze five different countries where I want to start selling my products. When I click on all the prospective countries, I get the option from Tableau to create either a set or a group:
In the scenario above, creating a group or set would produce a similar outcome – a new field in the data window that contains my countries of interest. Even more so, bringing that new field (whether a set or a grouped field) would produce very similar visual results, as well.
There are key differences though between sets and groups.
Groups are used to simplify a visualization that is using a dimension with a large membership. Adding groups creates a new field that can be used to categorize values in that dimension or even create another level in a hierarchy. Groups must be created within a dimension.
Sets are subsets of your data that are also based on existing dimensions. Sets get their own special area in the data pane. You can create a set visually by selecting marks or you can create a computed set by using logic that creates conditions on how the IN/OUT membership of the set will be calculated.
For example, I created a grouped field that has North American countries grouped, South American countries grouped and then all other countries left separate (or ungrouped):
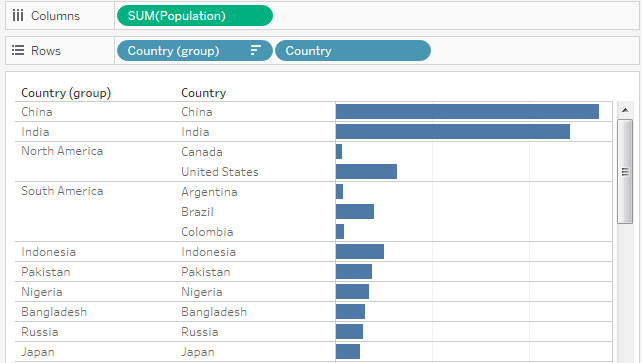
I could not replicate this example above with a set. When you create a group, you’re manually organizing members of a dimension, typically rolling them up to a higher level. The group created above is simply a collection of members within a dimension. Groups are static. New groups are not created if the underlying data changes. Instead, any new members will either appear ungrouped or inside of the Other group.
Remember, sets focus on members of the set that are IN as opposed to members that are OUT. As we’ll see in article #4 of this Deep Dive, sets also allow us to focus solely on the IN membership. This option changes the nature of how we can use sets.
Sets really shine when we apply conditional logic to dynamically update the members in the set.
Rather than manually selecting these countries, I could create a combination of sets that 1) includes only countries where products aren’t yet sold (i.e. new markets) and 2) has a minimum population threshold (i.e. opportunity). Since they are based from conditional logic, the members of that set would dynamically update as the underlying data changes. For instance, if I were to open business in China, it would be removed from my set of high-potential, new markets. These are logical conditions that my set is considering as it determines what is included or excluded each time it is used in my visualization.
Sets vs. Filters
Filters reduce the data that is visible either in our view or in our workbook depending on where your filters are applied. Filters can even use with logical conditions on measures or dimensions to modify the subset of data that is returned. This seems much more in line with the functionality of a set than what we saw from a group.
So, how are they different? The biggest difference is that sets can be saved. They create a new field, one that appears in the sets area of your data pane. As a result, your sets can be used in other areas, such as in calculated fields, as a component of another set and more.
Another key difference is where sets occur in Tableau’s order of operations, also known as the query pipeline. Sets are computed before dimension filters and measure filters. How does this effect your viz? Let’s take a deeper look.
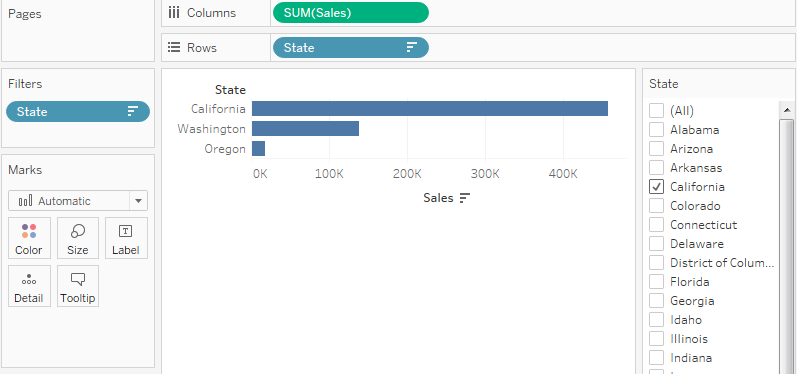
As a use case, let’s look at the Sample – Superstore data source that comes ready to use with Tableau Desktop. I want to show my SUM of Sales for all states that border the Pacific Ocean (California, Oregon and Washington). I’ll use State as a filter control, which changes my bar chart to only show those states. The problem comes with my filter control. It will still show all states in the State dimension, which isn’t what I want. I want my user to be able to select only from those three Pacific states.
This is not ideal. I want to exclude those extra states from showing up in my filter control completely. I can use a set to accomplish this feat. Within my set, I will only choose states border the Pacific Ocean. I’ll name my new set “Pacific States” and then apply it as a filter to get the following result:
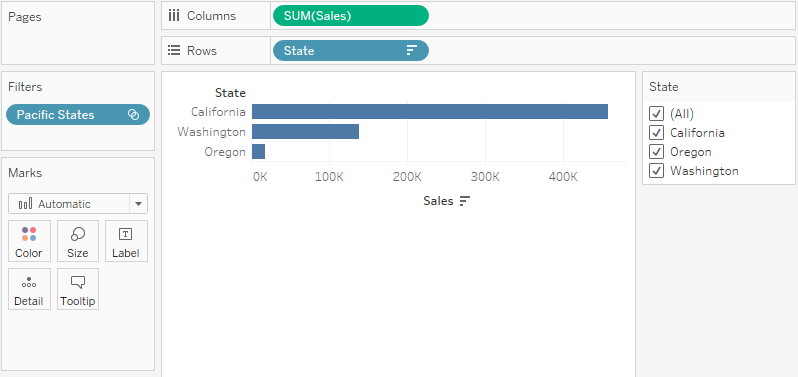
Now look at how my filter control for States is modified. My set is considered before my dimension filter as per Tableau’s order of operations, which is why only Pacific States are showing up in the filter control.
We’ll go through the steps on how to build this example as we progress through our Deep Dive on sets (see part 2).
What’s Next?
In the next few articles in this series, we’ll examine how to build constant sets (also known as manual sets) and computed sets. Leave any comments, questions or additional thoughts in the section provided below.
Cheers!