Tableau Deep Dive: Sets – Calculated Fields

Data

Tableau Deep Dive: Sets – Calculated Fields

Tableau Deep Dives are a loose collection of mini-series designed to give you an in-depth look into various features of Tableau Software.

The last two articles of this Deep Dive are going to focus on some advanced uses of sets. We’ll start by looking at how we can use sets in calculated fields. It doesn’t matter if the set was created manually or if the set is based on logical conditions. In either scenario, we can use our set – so long as we use an If/Then statement to test for members IN the set (True) or members OUT of the set (False).

Let’s examine a use case.

Use Case Example

We’ll use the Superstore – Sample data source that comes packaged with Tableau Desktop to construct all of our examples. In our hypothetical superstore, we want to create a sales goal based on our historical performances. We want to increase our sales by +20% in all markets that we have achieved a certain level of penetration, a minimum of 100 customers. This will be the IN of our set.

For the remaining states in which we have fewer than one hundred customers each, I want to instead calculate what our sales would be if we had 100 customers in that state. That’s our adjusted sales goal for those states. In our set, this will be the OUT.

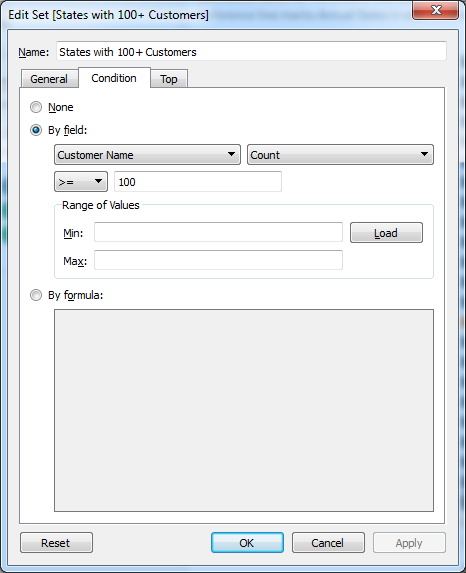
Let’s first create our set where we select states with 100 or more customers.

Create a set

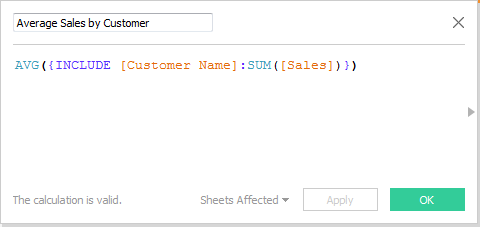
Now we can use our set in a calculated field that tests for the IN membership to perform one calculation and the OUT membership to perform another. First, we need to use a Level of Detail calculation to determine the average sales by customer. For more on these types of calculations, check out my Deep Dive on LODs.

Average Sales by Customer Calculated Field

Now I can build my calculated field using my set:

Sales Goal Calculated Field

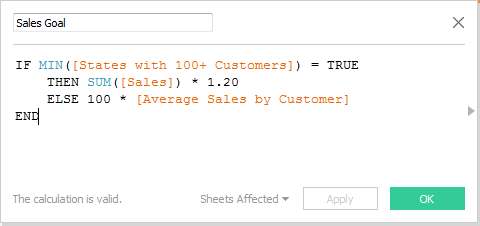
For the members IN our set, those that have 100 or more customers, we’re going to adjust their sales by +20%. For everything else, i.e. those NOT in the set, we’re going to calculate what the sales would be if they had a minimum of 100 customers.

Now let’s build our view. I’ll bring my Sales Goal calculated field onto Columns along with State and COUNTD(Customer Name) as a discrete field onto rows. Then I’ll build a reference line using SUM(Sales) to compare our actual sales against our goal. Finally, I’ll drag my set onto the Color button and add some notation in the view title to help my user understand our calculations.

That gives me the following result:

Result

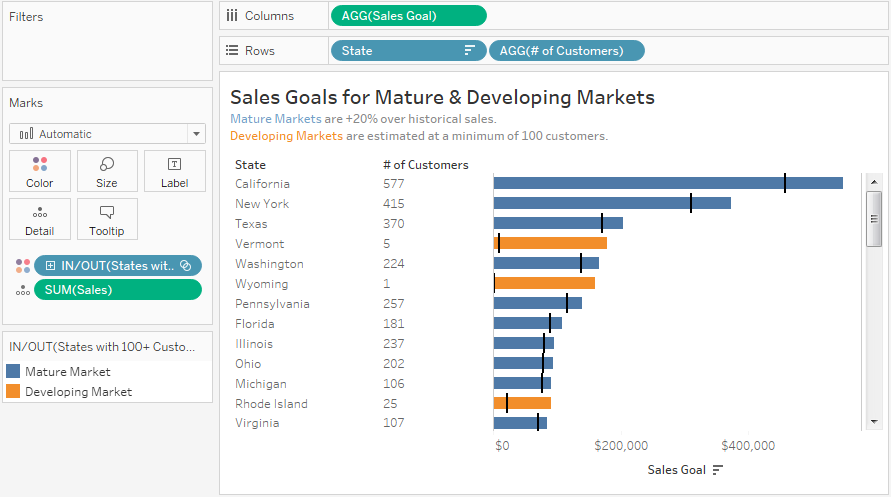
The states that are in orange are developing markets (less than 100 customers) and the markets in blue are my mature markets (100 or greater).

What’s Next?

Our final article in this Deep Dive explores how we can use a set within a hierarchy. As always, your comments and thoughts are appreciated in the area below.

Want More Tableau Deep Dives

  1. Tableau Deep Dive: LOD – Introduction to Detail
  2. Tableau Deep Dive: LOD – The Include Calculation
  3. Tableau Deep Dive: LOD – The Exclude Calculation
  4. Tableau Deep Dive: LOD – The Fixed Calculation
  5. Tableau Deep Dive: LOD – LOD Calculations vs. Table Calculations
  6. Tableau Deep Dive: Parameters – Parameter Overview
  7. Tableau Deep Dive: Parameters – Parameter Properties
  8. Tableau Deep Dive: Parameters – Filtering – Top N
  9. Tableau Deep Dive: Parameters – Calculated Fields
  10. Tableau Deep Dive: Parameters – Filtering Across Data Sources
  11. Tableau Deep Dive: Parameters – Bins
  12. Tableau Deep Dive: Parameters – Reference Lines
  13. Tableau Deep Dive: Parameters – Table Calculations
  14. Tableau Deep Dive: Sets – Introduction to Sets
  15. Tableau Deep Dive: Sets – Constant Sets
  16. Tableau Deep Dive: Sets – Computed Sets
  17. Tableau Deep Dive: Sets – IN/OUT
  18. Tableau Deep Dive: Sets – Combined Sets
  19. Tableau Deep Dive: Sets – Calculated Fields
  20. Tableau Deep Dive: Sets – Hierarchies
  21. Tableau Deep Dive: Dates – Introduction to Dates
  22. Tableau Deep Dive: Dates – Preparing Dates
  23. Tableau Deep Dive: Dates – More Date Functions
  24. Tableau Deep Dive: Dates – Exact Dates
  25. Tableau Deep Dive: Dates – Custom Dates
  26. Tableau Deep Dive: Dates – Rolling Dates
  27. Tableau Deep Dive: Dates – Calendar Filters
  28. Tableau Deep Dive: Dates – Week-by-Week Comparison
  29. Tableau Deep Dive: Dashboard Design – Planning
  30. Tableau Deep Dive: Dashboard Design – Layout & Structure
  31. Tableau Deep Dive: Dashboard Design – Proof of Concept
  32. Tableau Deep Dive: Dashboard Design – Adding Interactivity
  33. Tableau Deep Dive: Dashboard Design – Visual Best Practices
  34. Tableau Deep Dive: Dashboard Design – Optimization & Governance
  35. Tableau Deep Dive: Dashboard Design – Publishing
  36. Tableau Deep Dive: Table Calculations – Custom Sorts, Part One
  37. Tableau Deep Dive: Table Calculations – Custom Sorts, Part Two
  38. Tableau Deep Dive: Table Calculations – Custom Sorts, Part Three

More About the Author

Robert Curtis

Managing Director, APAC
Building Solutions with InterWorks at Corinium’s Data Architecture Conference in Melbourne InterWorks was a proud sponsor of the Data Architecture Conference hosted by Corinium in Melbourne on 21 and 22 June 2023. Hundreds of ...
Virtual Event Recap: Deep Dive of Tableau Parameters For our June Lunch and Learn, we did a deep dive on parameters for our friends across Australia and Singapore. Tableau is the premier ...

See more from this author →

InterWorks uses cookies to allow us to better understand how the site is used. By continuing to use this site, you consent to this policy. Review Policy OK

×

Interworks GmbH
Ratinger Straße 9
40213 Düsseldorf
Germany
Geschäftsführer: Mel Stephenson

Kontaktaufnahme: markus@interworks.eu
Telefon: +49 (0)211 5408 5301

Amtsgericht Düsseldorf HRB 79752
UstldNr: DE 313 353 072

×

Love our blog? You should see our emails. Sign up for our newsletter!