Tableau Deep Dives are a loose collection of mini-series designed to give you an in-depth look into various features of Tableau Software.
Level of detail (LOD) is a feature that was introduced in Tableau Desktop v9. While it offers a great amount of flexibility and control over how you use the data in your visualization, it can be a bit tricky to fully understand.
We teach level of detail in the Advanced course of Tableau training. With so much to cover in such little time, it’s impossible to delve very deep into any particular topic. That’s why we’re covering these topics in a new mini-series format called Deep Dives. The goal of this format is to take the extra time to fully explore a complex Tableau topic.
In this Deep Dive, we’ll cover Level of Detail with the following articles:
- Part 1: Introduction to Detail
- Part 2: The Include Calculation
- Part 3: The Exclude Calculation
- Part 4: The Fixed Calculation
- Part 5: LOD vs. Table Calculations
The Rows and Columns Shelves
To understand what LOD is as well as the when/where/why you’ll need to use it, let’s first review the idea of detail. On your visualization, there are three areas that primarily determine the detail of your view. The first two are the Rows and Columns shelves. Detail is defined by the dimensions you use to segment your measures. It doesn’t matter if you put your dimension in the Rows shelf or the Columns shelf, it will just change how the axes are labeled – it’s the difference between a horizontal bar chart and a vertical one.
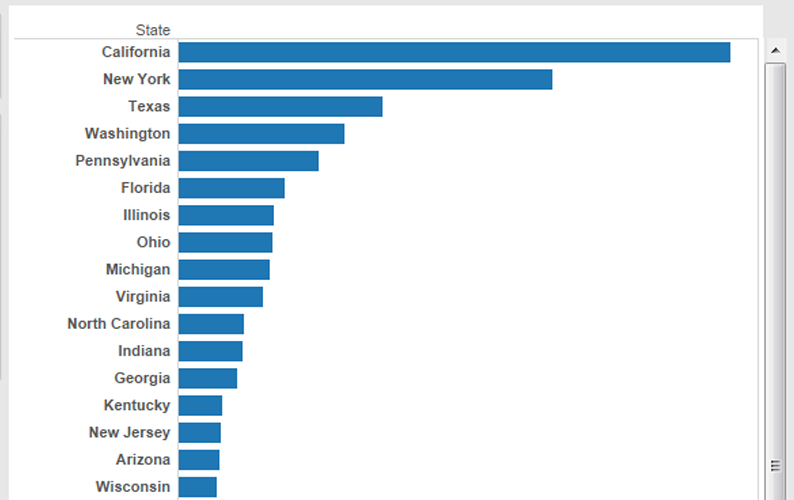
For example, if you place State in the Rows shelf, your visualization will segment your measures based on that level of detail.

In the above example, our view is going to aggregate the sum of sales by State, like so:

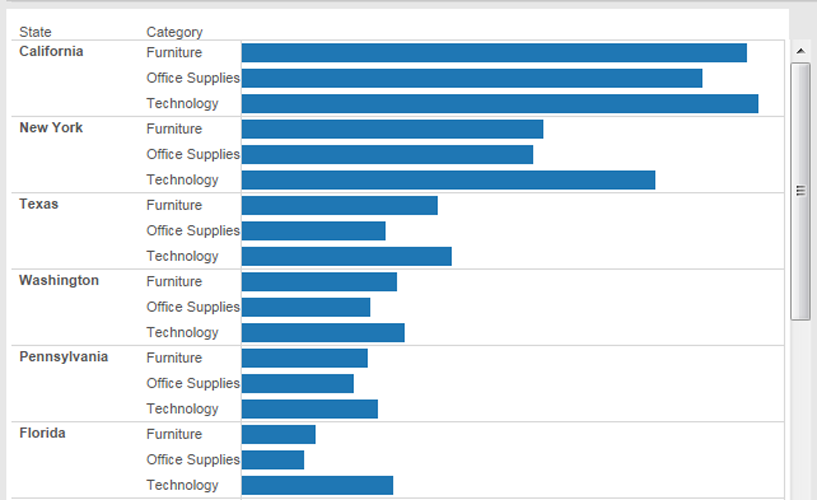
If I add another dimension to our example above, say inserting Category after State, we get more granularity and less aggregation in our bar chart. In other words, we’re adding to our level of detail. Here’s what that looks like:

The Detail Shelf (or Detail Button)
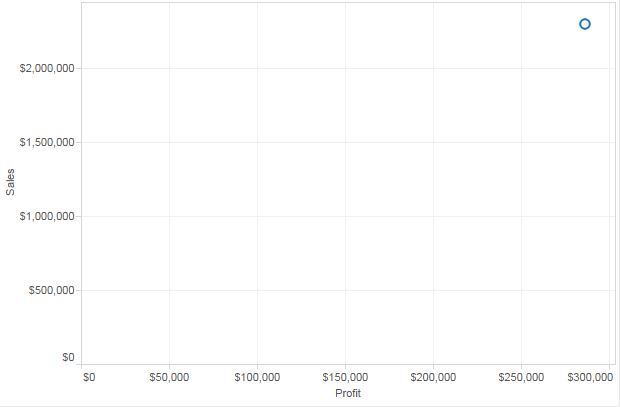
The other spot in Tableau Desktop to determine level of detail is the Detail shelf on the Marks card. This is also commonly referred to as the Detail button. Dragging dimensions onto the Detail shelf will affect your visualization in different ways, depending on your chart type. Let’s take a scatter plot with Profit and Sales on the respective axes:

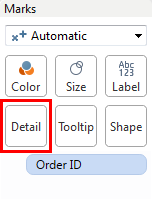
Currently, there is only a single mark on our scatter plot because we are not currently segmenting these measures on any dimensions or disaggregating the results. In other words, our level of detail is at our highest or most aggregated. Let’s add granularity by dragging Order ID onto the Detail shelf:

In this instance, adding a dimension to the Detail shelf will dramatically change the view. Here’s how that affects our scatter plot:

We now have marks for every individual Order, making this visualization less aggregated and more granular. Adding color or changing the mark shape will obviously make this scatter plot easier to read.
Level of Detail (LOD) Calculations
LOD calculations allow you to add a fourth option in determining the level of detail. The great thing about LOD in Tableau is that you can do this independently from the dimensions used within your visualization. If I drag a field onto the Rows, Columns or Detail shelves, then the entire view is going to be affected. LOD allows us to set the level of detail we want for a particular field, independent of the view.
There are three different options when using LOD calculations: Include, Exclude and Fixed. We’ll continue Part 2 of this Deep Dive with LOD Include.
If you have any thoughts of questions for Part 1, please leave them in the comments section. We’d love to hear from you!

