
Tableau Deep Dives are a loose collection of mini-series designed to give you an in-depth look into various features of Tableau Software.
We’re continuing our Deep Dive into Dates with an examination of the Exact Date value. Remember to catch up on the previous three articles where I introduced dates (discrete vs. continuous) and some key date functions. Let’s get started!
Exactly What is Exact Date?
In our first article, we learned the difference between discrete and continuous dates. Discrete dates use date parts to form a hierarchy. If have all of the date parts possible for that date, then I can get a specific date (or date and time). Continuous dates use date values to determine their level of detail. You’re using a timeline either way, but date values determine the unit of measure of how you’re going to group your aggregated data.
Exact date is a date value, which makes it by default a continuous date. Think of it as a specific point on the timeline. It is the lowest level of detail possible for your data type. For date, it is all the way down to the day level. For date and time, you’re going down to seconds.
Let’s look at a discrete date hierarchy that is completely expanded down to the lowest level:
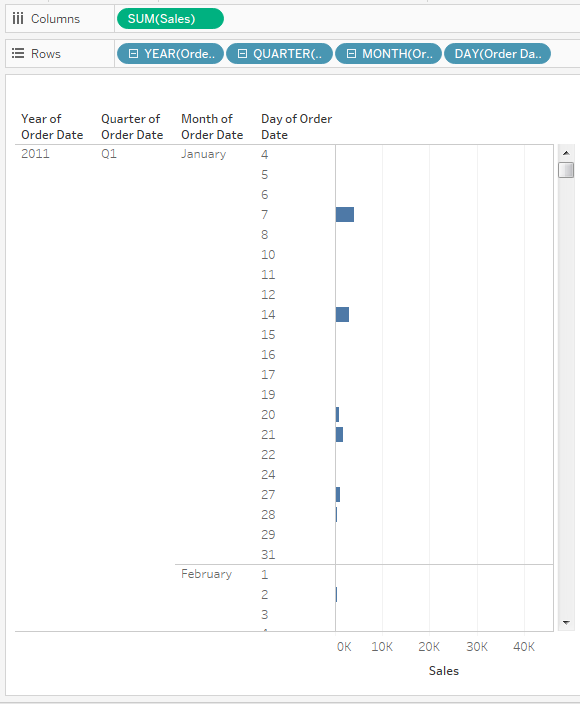
You can see immediately this is a very inefficient way to display the data. Even if we changed the above view from a bar chart to a line graph, each level of the date part hierarchy is creating a row header that has to be displayed.
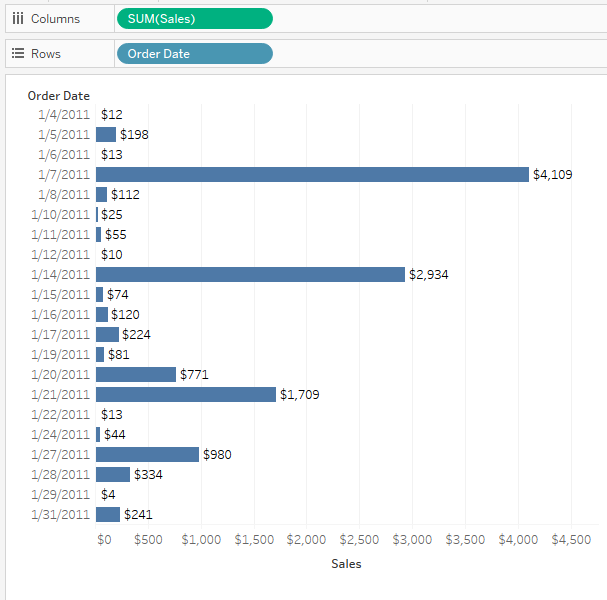
Let’s show our sales data using exact date, which is by default continuous:
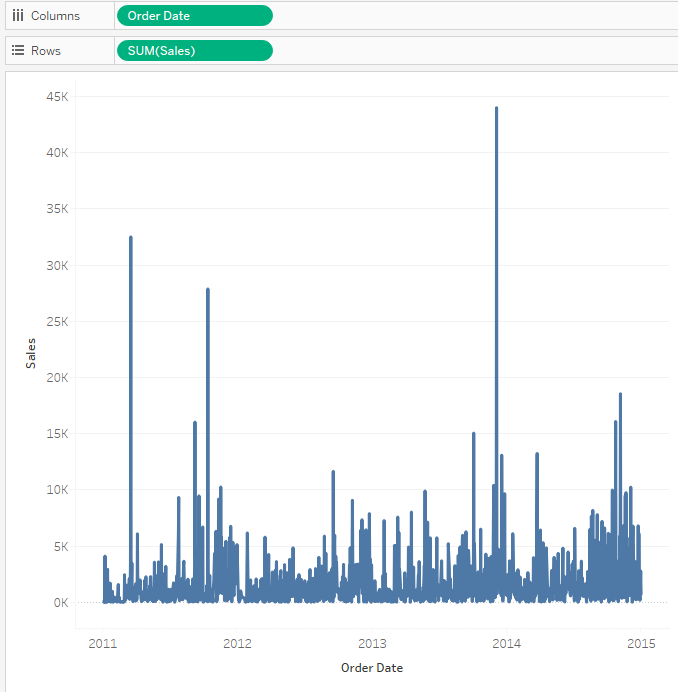
Right away you should notice that our Order Date field has no qualifying date part or date value on it. It simply says Order Date. That’s how we know it is the exact date in the data source.
This is much easier to digest. The difference with a continuous date is that even though are mapping all of the data points, our view gives us the flexibility to view all of the data by compressing them into the viewable area. Without having to worry about headers, Tableau can automatically adjust the axis tick marks for the allowable space. If we compressed our discrete date into Fit Entire view, it’d be unreadable.
The date field in Sample – Superstore has the date data type, which means it only goes down to day. In this instance, exact date would be the same as setting your date value in your continuous date field to Day().
Let’s Be Discrete
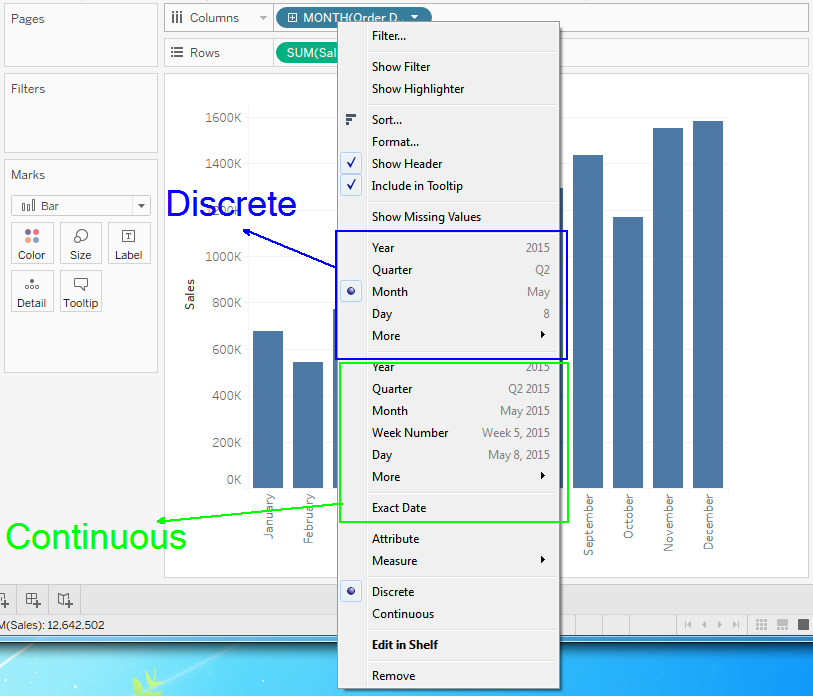
I said that exact dates are by default continuous. That doesn’t mean they can’t be discrete, too. It’s opposite day and anything is possible. When you right-click on a date field, you get the option of choosing a discrete date (i.e. date part) or a continuous date (i.e. date value):
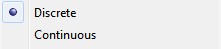
Even though I have these labeled as discrete and continuous that is there default setting. These can be changed. If you look below, you’ll see a toggle between Discrete and Continuous here:
Let’s use this to hardcode our continuous exact date to be a discrete field. It will allow us to use the most granular date value as a header in our view. To help illustrate this, I’m going to switch our exact date view from above. Instead of our date field being on Columns, I’m going to put it on Rows (like we did with our date part hierarchy):
Notice how Order Date is now a blue field on rows. You can see that we don’t to have arrive a specific date cobbled together with different date parts to get a header. Instead, we get a nice clean date for each header.
Use Case: Testing for Homogeneity
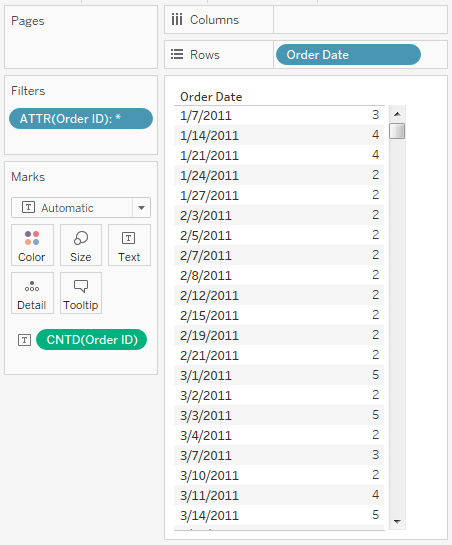
Let’s use our discrete exact date as row headers for a sample analysis. I’m interested in seeing every day where we had multiple orders. Let’s take Order ID and drag it onto our view to create a text table:
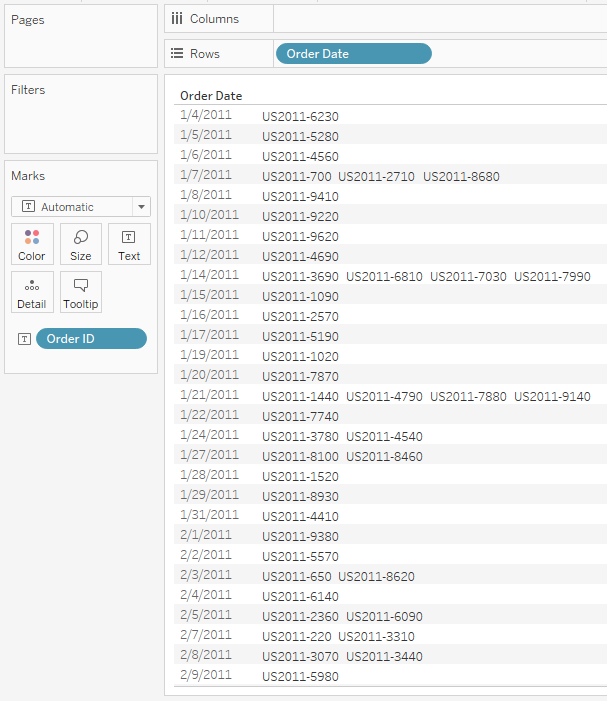
Each Order ID is now listed on our discrete exact date. Let’s add the ATTR() to Order ID function to test for homogeneity. Any day that has more than one Order ID is going to show us as an asterisk. Any date that has a single Order ID is going to return that single id. You can learn more about the ATTR() function in an article written by my InterWorks teammate, Tim Costello.
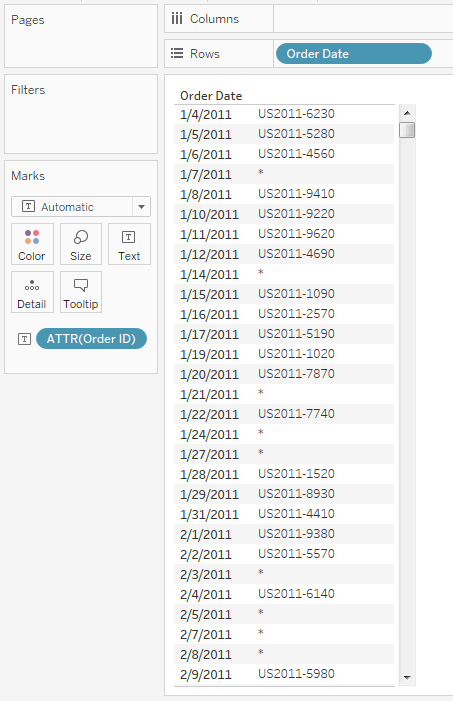
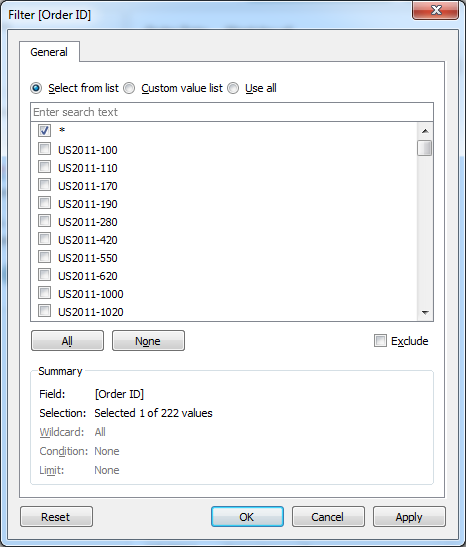
Let’s move our ATTR(Order ID) up to the Filters card and make sure we select Attribute when it prompts us on what type of filter we want:
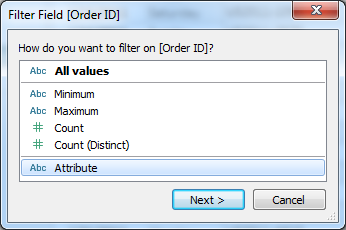
Then we can filter for only days that have multiple orders:
We are now filtering out all dates that did not have multiple orders. To make our view useful, let’s analyze how many orders occur on average on multi-order days and which day they most likely occur on. Let’s start by adding a CNTD(Order ID) on our label:
Next, let’s calculate the % of total that multi-order days happen on which weekdays. To do this we’ll use a level of detail calculation:
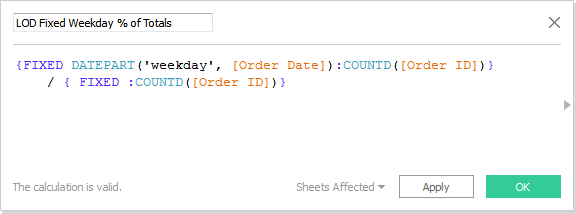
In this calculation, I’m breaking each order into each weekday and then dividing by the whole of the data source to get an accurate % of total. Let’s finish up our view by including our LOD calculation into the text table and adding a single value drop-down list for Weekday:
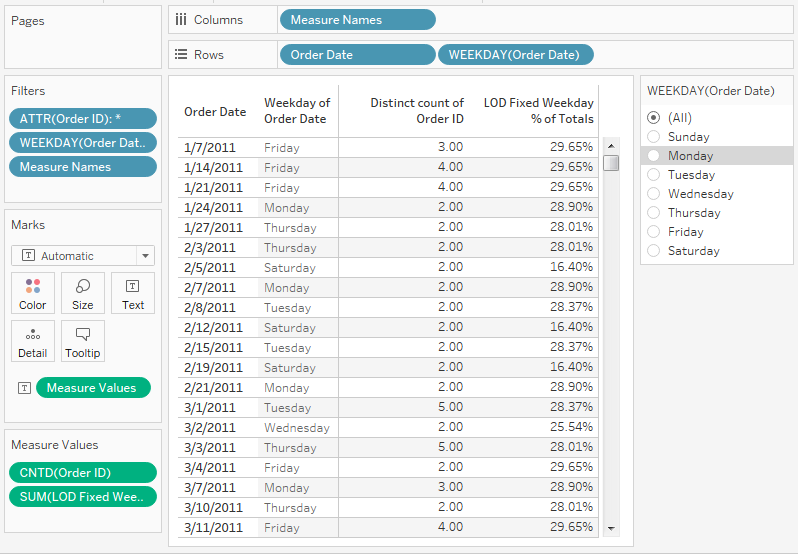
Looking at our data, some assumptions are probably confirmed. We sell office supplies primarily and the largest bulk of our orders are during business days, especially Monday at nearly 29%. Sunday is a measly 3.29%. That gives a strong indication our customers are ordering while at work.
What’s Next?
In our next article, we’ll tackle custom dates. Custom dates allow us to choose a persistent date part or date value for our newly created calculated date field. Until then, please put any thoughts or questions in the comments section below.