
Tableau Deep Dives are a loose collection of mini-series designed to give you an in-depth look into various features of Tableau Software.
Let’s continue our exploration of dates in our Deep Dive. In Part 6, we’re going to focus on how we can create rolling dates. A rolling date is taking a specific date, such as order date, and then adding a certain amount of days, months or whatever date part we need. For example, a rolling year would take the original date and set the ending time frame up by one year.
There are a couple of ways to do this – using a continuous date filter or using calculated fields. Each one solves specific use cases.
Relative Date Filter
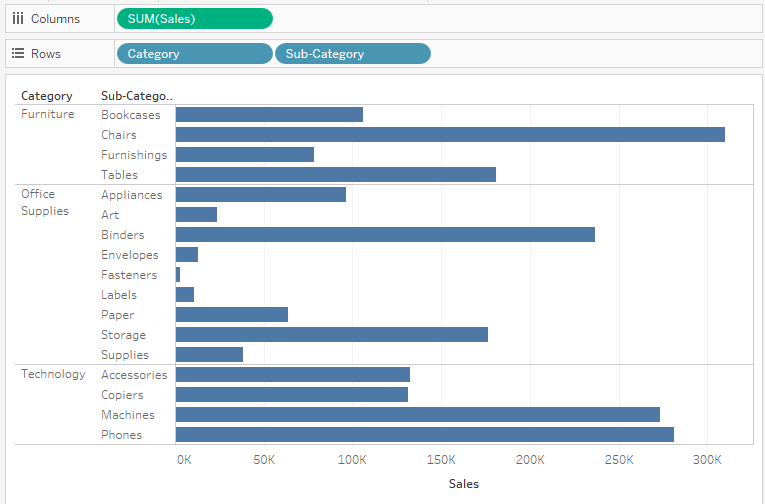
Continuous dates filter just like continuous fields with one big exception. We gain an extra piece of functionality – relative dates. A relative date filter allows us to pick a date and then define the size of our window to filter. Let’s take the following view and create a 90-day relative date filter from our current date.
I’ll right-click drag on Order Date in the data pane and pull it onto the Filters card. Doing this is a short cut which will take me right to this helpful menu:
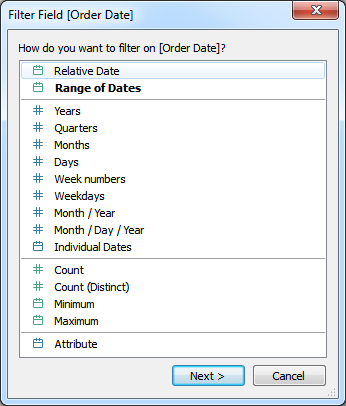
I want to select Relative Date and click Next. Now I get the continuous filter window:
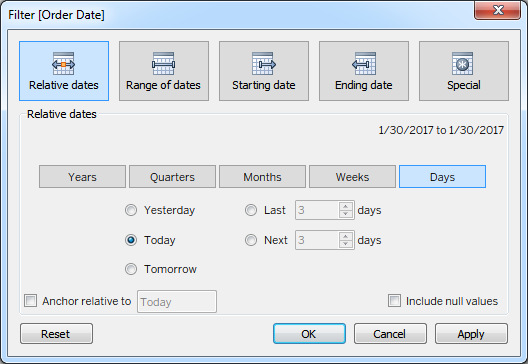
There are two important aspects to the options presented here for a relative date. The first is what is going to be the anchor date? You have the option of selecting yesterday, today, tomorrow or choosing a specific date with Anchor Relative To. The second piece is choosing your date part and the units. Do we want last seven days? The next six months?
Let’s set up our relative date filter for the previous 90 days from today:
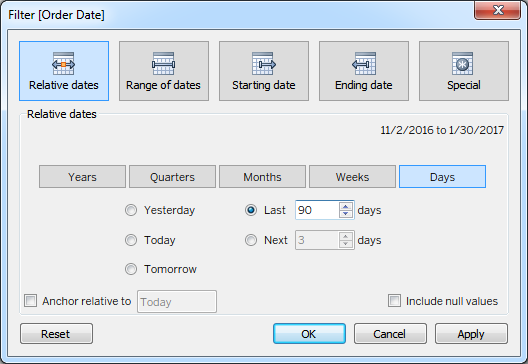
Our view will now only show sales performance from approximately the three previous months (90 days). To help our user, let’s add some context into our worksheet title for a final view like this:
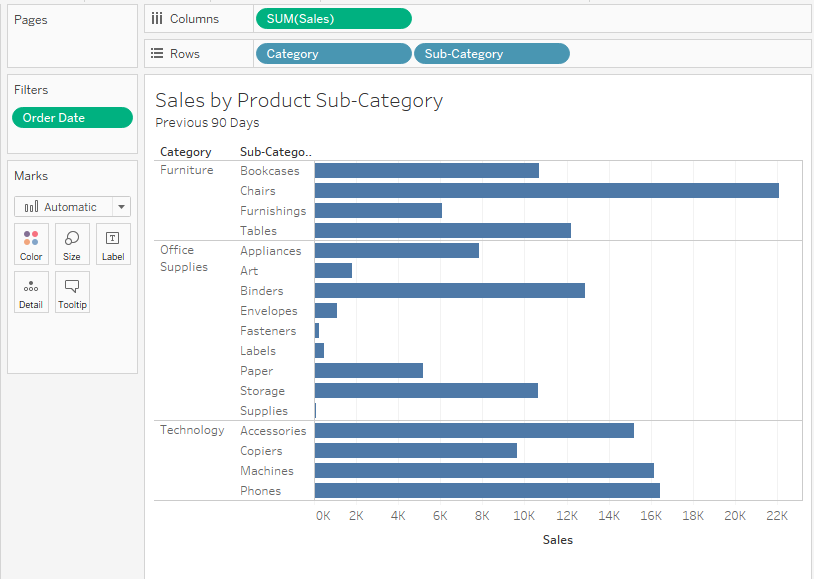
Easy as pie!
Rolling Date Calculated Field
Our next use case examines a need to show performance date from a rolling date relative to a specific dimension member. The relative date filter above filters the entire view on a specific range of dates. In our next view, I’m going to create calculations that will show a rolling year of sales for each row in my table. Let’s say I want to visualize first year’s sales from my phones sub-category from the date of their respective product release.
We’ll need to start with some calculations. Level of Detail calcs to the rescue! For more information on LODs, check out that Deep Dive series. The first thing I need to do is to create my rolling year for each product:
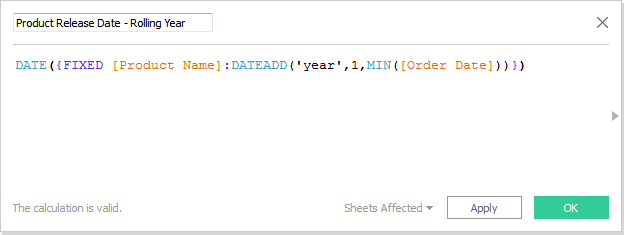
Let’s break down this calculated field, because there’s a couple of different things happening here. First, I’m creating a rolling year by using DATEADD to add one year to the first order (i.e. minimum of Order Date). Second, I’m using an LOD to fix it to product name, so each product will have a unique date value. Finally, I’m wrapping the whole thing in the DATE function so it doesn’t return as date and time. All of my date fields in Sample – Superstore are date only, so I’m just being more precise in choosing my data type.
Next, we need to create a calculation that will determine our sales in that first year:
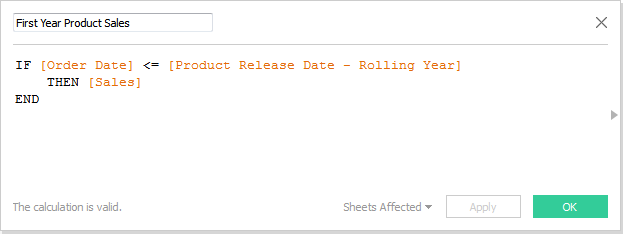
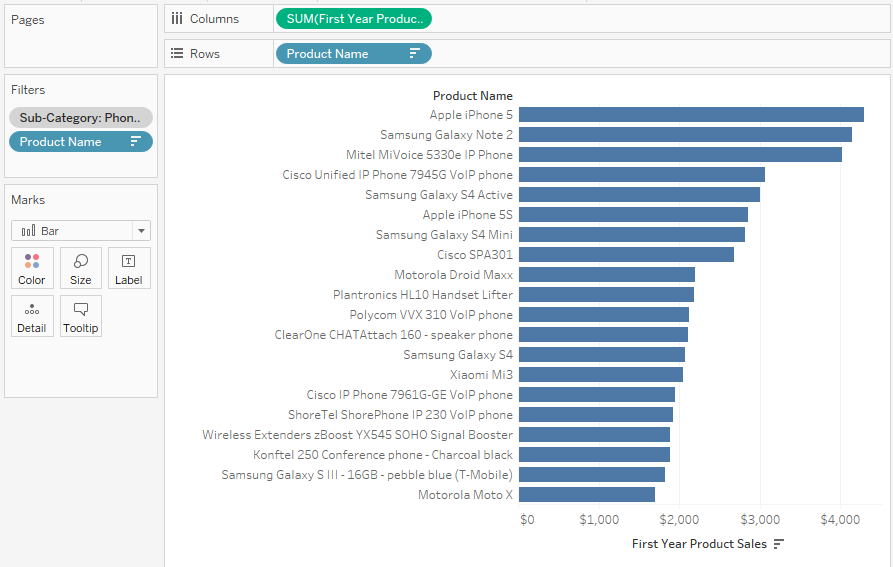
Remember, do not add an aggregation to Sales, else your calculation will break as Order Date is not aggregated. Now let’s build our view. I’m going to add Sub-Category to the Filters card and select only phones. Next, put Product Name onto Rows and sum of First Year Product Sales onto Columns. Finally, let’s tighten up our view by showing only the top 20 products:
![Filter [Products Name]](/wp-content/uploads/sites/default/files/blog-content/TDDDatesRolling8.png)
I’ll need to make Sub-Category a context filter, too. Otherwise, our top 20 products will be picked from all of the product offering. Right-click on Sub-Category in the Filters card and select Add to Context. Here’s our final view:
If you wanted to add a bit more information to the table, we could add our MIN(Order Date) and our Product Release Date – Rolling Year fields as discrete exact dates to Rows, as well. That gives us this view:
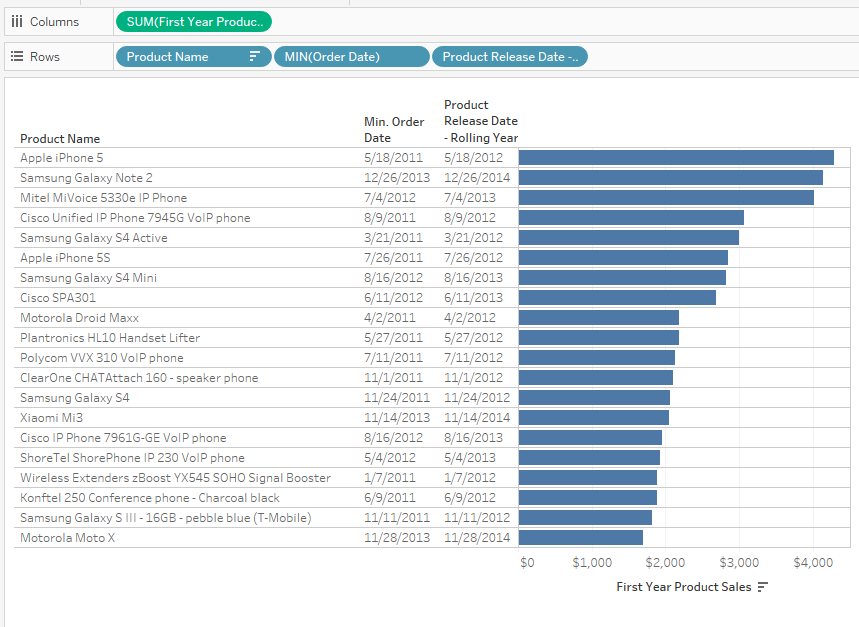
This same logic could be applied to other analyses, such as customer cohorts.
What’s Next?
I hope you find these helpful. In our next article, we’ll create a calendar style filter that you can use on a dashboard. Until then, please let me know any thoughts or questions in the comments section below. Cheers!