Questions from Tableau Training: Top N Highlight Table

Data

Questions from Tableau Training: Top N Highlight Table

Our Certified Tableau Trainers are asked a myriad of questions each day. In this series, they share some answers.

While teaching a Desktop I and II Accelerated class last week in Perth, I got an interesting question from a Tableau student named Clint.

“Can you make a highlight dynamic so that it will highlight just the top 10 or top 20?”

When it comes to Tableau, the answer is always a big YES! For this particular solution, we’ll use a combination of mark cards, parameters and calculated fields. Let’s build it!

Start with a Crosstab

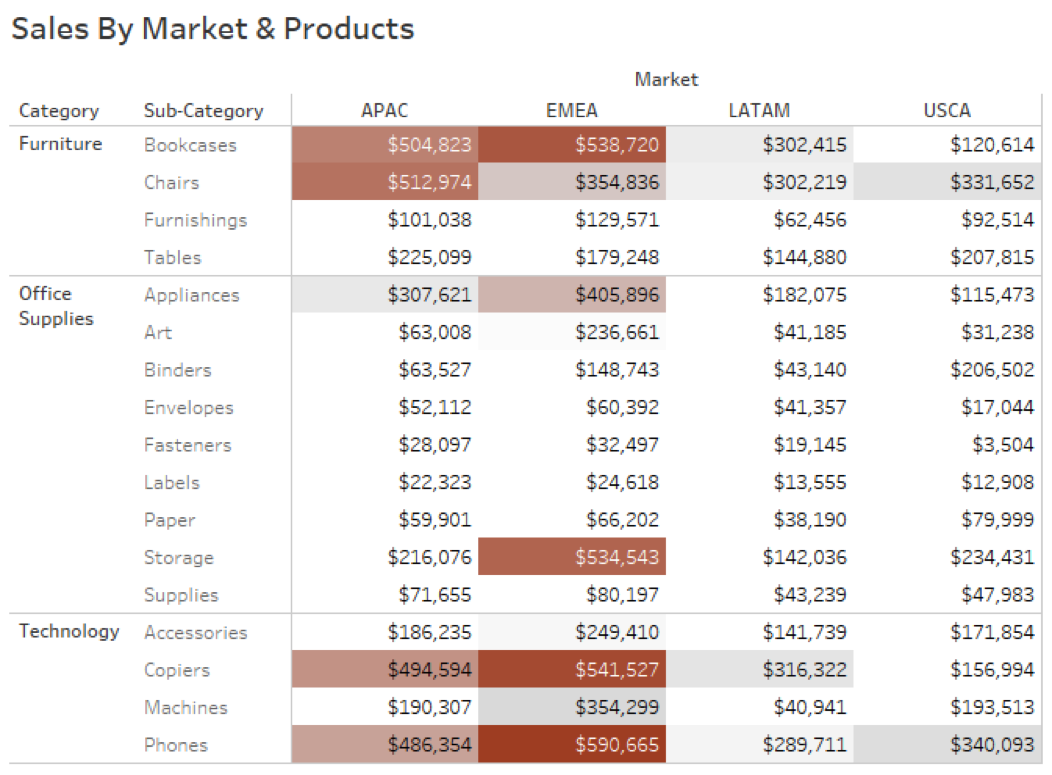
I’ll start by using the publicly accessible Global Superstore data set from Tableau. We’ll begin our exercise with the following crosstab:

Questions from Tableau Training Top N

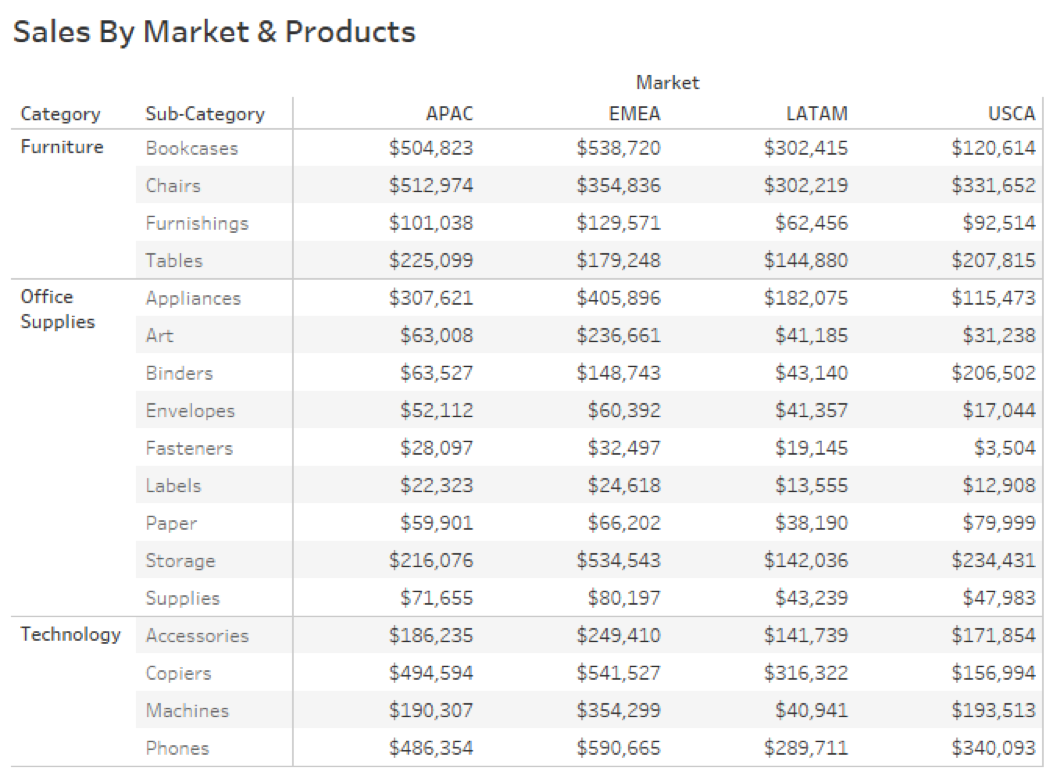
Arrange Market on Columns with Category and Sub-Category on Rows. We’ll add Sales onto the Text button, formatted as Currency Custom without any decimals.

Build the Parameter

We’ll add a parameter to our crosstab to enable our user to pick how much of the table they want to highlight. I spent a lot of time on this topic in my Deep Dive on Parameters series. Read through the posts if you need a refresher on how parameters work. Here’s how we’ll build our parameter control for our Top N:

Questions from Tableau Training Top N

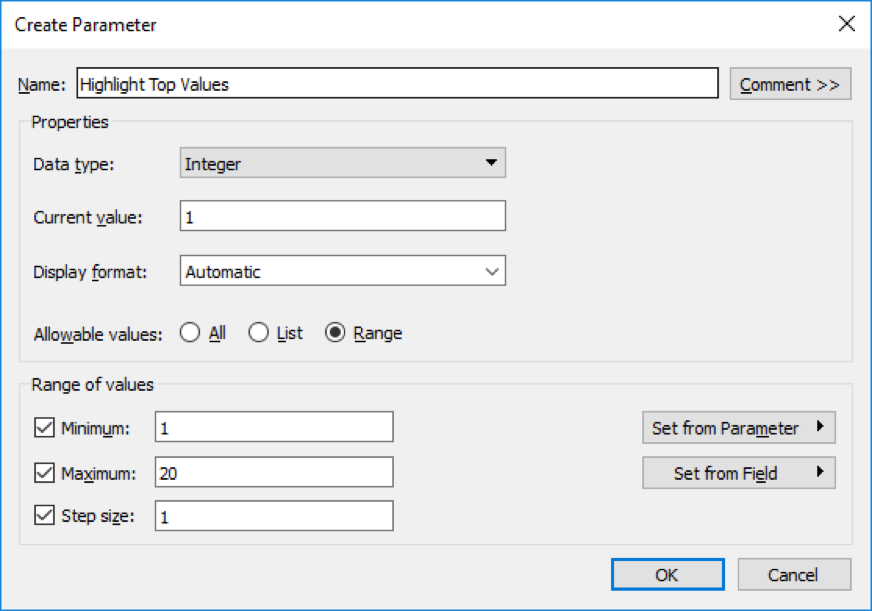
This will allow our user to see from the top 1 to the top 20 highlighted in the crosstab. This functionality closely mirrors the flexibility you have in Excel to arbitrarily show the top N in tables. Within Tableau, which is more programmatic in its formatting, we’re relying on our parameter above to help.

Calculated Fields

Our range of values is pretty wide. To help normalize these colors and make them more distinct across our Top N, let’s use the Rank table calculation. We’ll need two different calculations. The first is for our color gradient. Here’s the calculation:

Questions from Tableau Training Top N

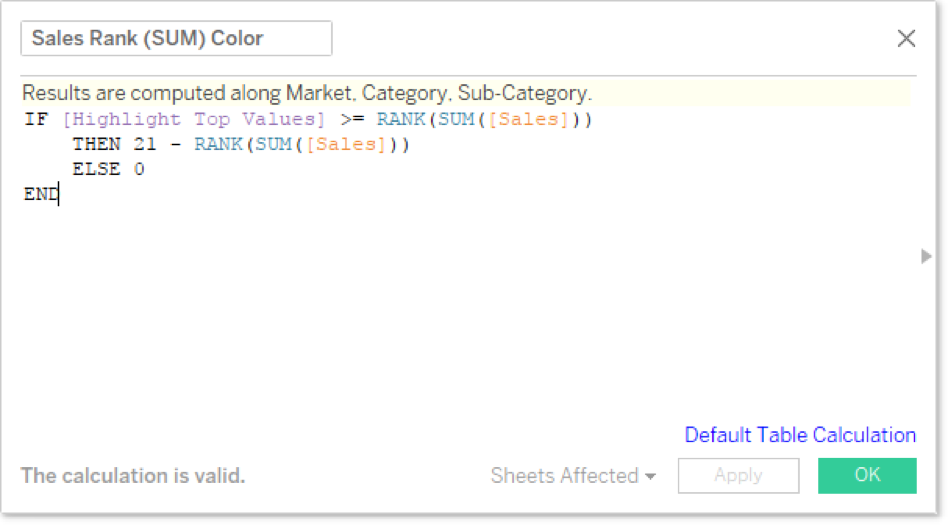
Our top value (i.e. the first rank) will have an assigned value of 20 on our color gradient as a result of the calculation above. We need to take our 1, 2, 3, etc. rank and arrange them from high to low. If you want to show more than a top 20 in your parameter, simply take your highest range increment and type +1 for this calculation instead of 21.

All other values outside the Top N selection are assigned a value of zero. The second calculation is for our rank label to be placed alongside our sales value. Here’s the calculation:

Questions from Tableau Training Top N

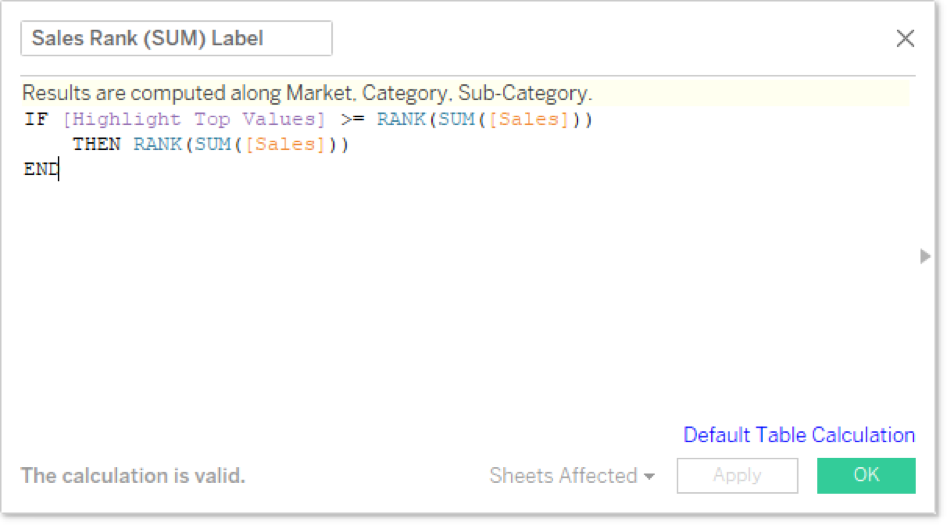
Our goal here is to add a rank to our highlighted cells. If the cell is not within the Top N, then we ignore it for this calculation.

Marks Card: Color Button

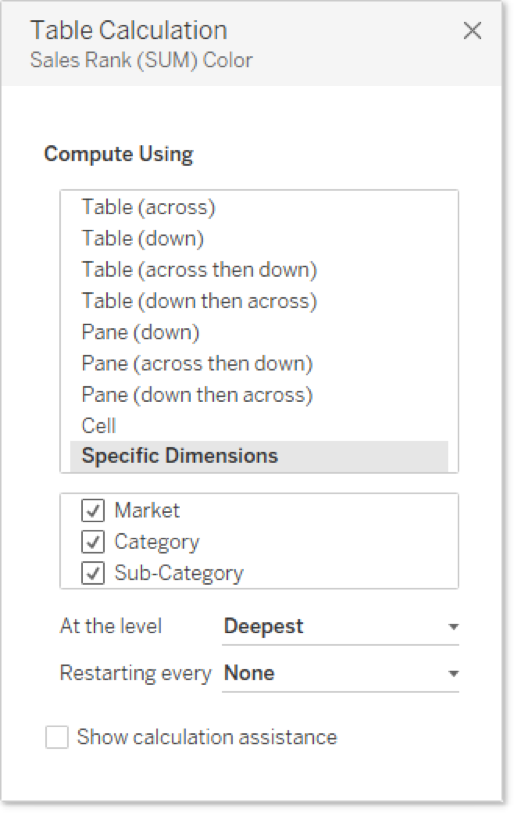
Now, let’s add our calculated fields to our Marks card and do some tricks on our color legend. First, add the Sales Rank (SUM) Color calculated field to the Color button. We’ll need to ensure that the Rank table calculation is computing using specific dimensions. I want a rank across the entire table for all fields, like so:

Questions from Tableau Training Top N

For the color gradient, I want one end of the spectrum to be a color and the other end to be white. At the bottom of the color palette drop-down box, there is an option for Custom Diverging colors. I can’t use Custom Sequential, because it will default one end of my spectrum to light grey. I need to specify white, so I’ll choose red to highlight my Top N. Here are our colors:

Questions from Tableau Training Top N

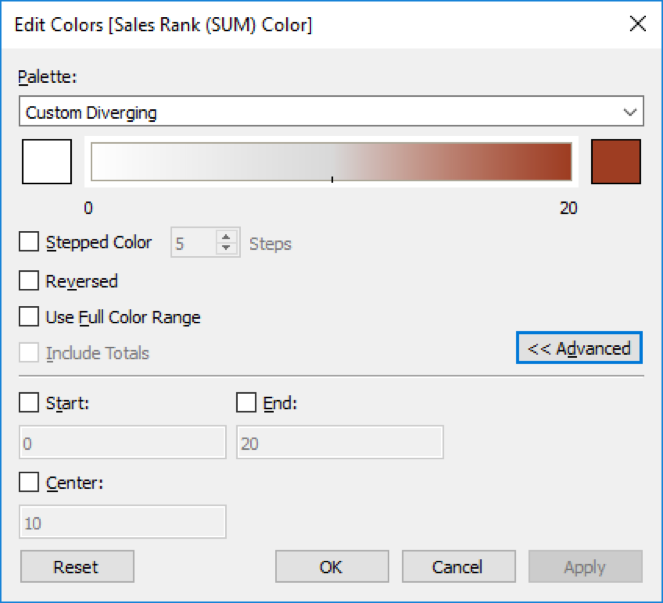
I’ve expanded the Advanced options to show how our calculated field will interact. Our #1 rank will always be the value of 20 at the top of the spectrum. Our bottom end normalizes all other numbers outside the Top N as 0. It creates a concise gradient where there are discernible differences between our values in the highlight table.

If we don’t do this trick on the color palette, the range of numbers could be so diverse that the top ten ranks could basically be the same color in our view, which will only highlight the top numbers rather than indicate their order. This gives us the following view so far:

Questions from Tableau Training Top N

Marks Card: Label Button

We could stop here, but I want to add a little extra notation for the rank on our Top N to make it easier to discern which shade of red is higher. I’m going to use our second calculated field and drop that onto the label button and format it to look like a subscript, like this:

Questions from Tableau Training Top N

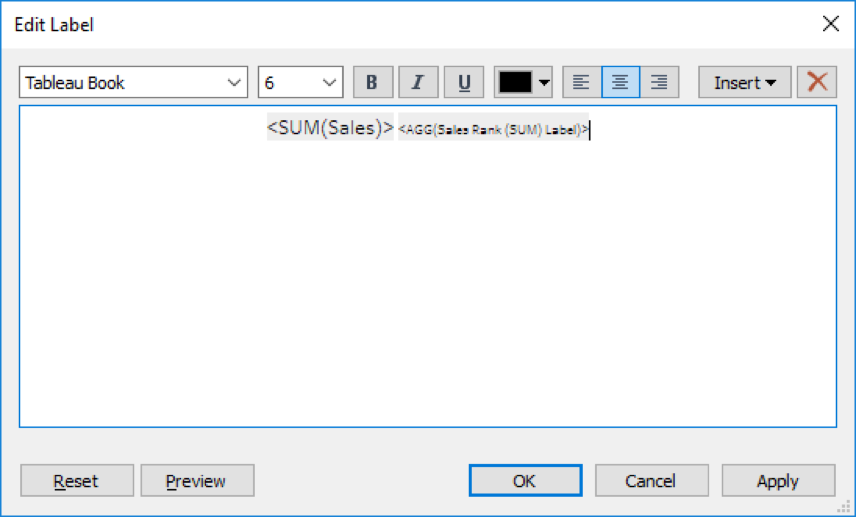
Even though the font size drop-down stops at eight, you can manually enter in a smaller number. I used six to really differentiate the size of the sales text from the rank number.

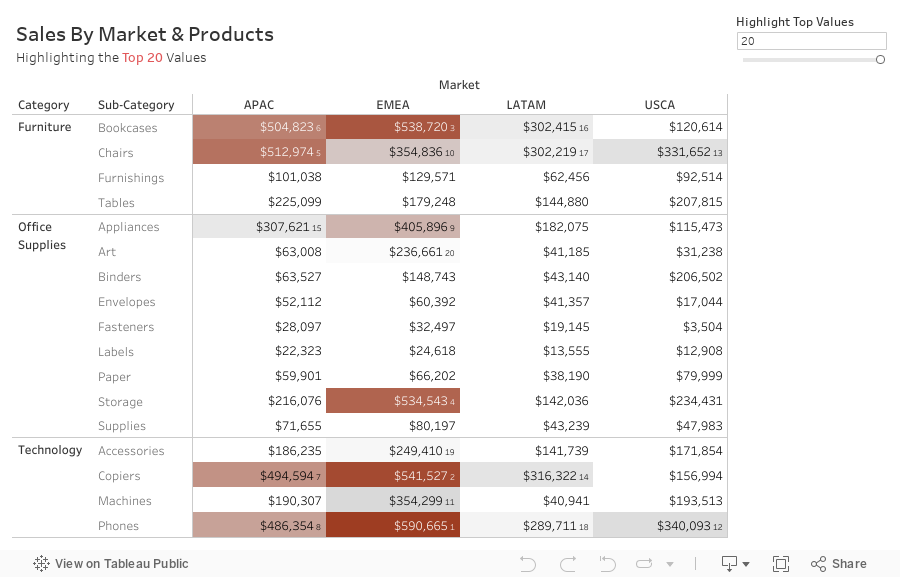
Let’s add a finishing touch for a sub-title to have some context for our Top N filter. Here’s how our table is published on Tableau Public. And don’t forget to show that parameter control!

And we are done-zo! Thanks, Clint!

Want More Questions from Tableau Training

  1. Questions from Tableau Training: Quick Filter Interaction
  2. Questions from Tableau Training: Labeling with Table Calculations
  3. Questions from Tableau Training: Speeding Up Presentation Views when Using Tableau
  4. Questions from Tableau Training: Dashboard Actions
  5. Questions from Tableau Training: Business Day Calculations
  6. Questions from Tableau Training: Adding Gaps Between Bars
  7. Questions from Tableau Training: When to Pivot Data in Tableau
  8. Questions from Tableau Training: Adding Conditional Formatting
  9. Questions from Tableau Training: Setting Weekday Start
  10. Questions from Tableau Training: How Do ZIP Codes Work in Tableau?
  11. Questions from Tableau Training: The Small Grey Bar Within a Quick Filter
  12. Questions from Tableau Training: Matching Mark Color
  13. Questions from Tableau Training: Showing the Null Indicator
  14. Questions from Tableau Training: Can I Manually Set the Colors of a Stepped Gradient?
  15. Questions from Tableau Training: How Can I Get Box Plot Data into a Crosstab?
  16. Questions from Tableau Training: How Do I Clear a Worksheet? Make a Copy?
  17. Questions from Tableau Training: Opening URL Actions Inside of a Dashboard
  18. Questions from Tableau Training: Can I Move Mark Labels?
  19. Questions from Tableau Training: How Can I Use My Current Report to Create a Viz?
  20. Questions from Tableau Training: Can I Create Text Hyperlinks on a Dashboard?
  21. Questions from Tableau Training: How Can I Transform My Crosstab into a Flat List?
  22. Questions from Tableau Training: Labeling the Top N
  23. Questions from Tableau Training: How Can I Customize Charts with Parameters?
  24. Questions from Tableau Training: Combining Measures into a Single Line
  25. Questions from Tableau Training: How Can I Create Custom Color Palettes?
  26. Questions from Tableau Training: Can a Top N Parameter be Nested Within Other Fields?
  27. Questions from Tableau Training: Conditional Scope on Tableau Calculations
  28. Questions from Tableau Training: Top Ten Plus N
  29. Questions from Tableau Training: Dynamic Label Positioning
  30. Questions from Tableau Training: Using Cross Joins to Solve Active Tickets
  31. Questions from Tableau Training: Top N Highlight Table
  32. Questions from Tableau Training: How to Use Specific Dimensions in Table Calculations
  33. Questions from Tableau Training: Moving Reference Line Labels
  34. Questions from Training: Comparing Metrics for Same Weekday in Previous Year
  35. Questions from Tableau Training: Colouring Specific Columns and Rows in a Crosstab
  36. Questions from Tableau Training: Creating a Custom Legend as a Sheet
  37. Questions from Tableau Training: How Can I Draw a 45-Degree Angle?
  38. Questions from Tableau Training: Down the Aggregation Rabbit Hole
  39. Questions from Tableau Training: Percent Change from Previous Period on a Map
  40. Questions from Tableau Training: Union File Names as Years
  41. Questions from Tableau Training: Conditional Coloring on Sparklines
  42. Questions from Tableau Training: Moving Column Headers to the Top of the View
  43. Questions from Tableau Training: Isolating Rank with Parameters and Calculations

More About the Author

Robert Curtis

Managing Director, APAC
Kickstarting Data Innovation in Healthcare On 13 March 2024, InterWorks was a proud Platinum sponsor of the first ever Data & Analytics in Healthcare conference, hosted by ...
Building Solutions with InterWorks at Corinium’s Data Architecture Conference in Melbourne InterWorks was a proud sponsor of the Data Architecture Conference hosted by Corinium in Melbourne on 21 and 22 June 2023. Hundreds of ...

See more from this author →

InterWorks uses cookies to allow us to better understand how the site is used. By continuing to use this site, you consent to this policy. Review Policy OK

×

Interworks GmbH
Ratinger Straße 9
40213 Düsseldorf
Germany
Geschäftsführer: Mel Stephenson

Kontaktaufnahme: markus@interworks.eu
Telefon: +49 (0)211 5408 5301

Amtsgericht Düsseldorf HRB 79752
UstldNr: DE 313 353 072

×

Love our blog? You should see our emails. Sign up for our newsletter!