Tableau Essentials: Chart Types – Side-by-Side Bar Chart

Data

Tableau Essentials: Chart Types – Side-by-Side Bar Chart

Not everyone is a Tableau guru, at least not yet. To help Tableau rookies, we’re starting from square one with the Tableau Essentials blog series. The series is intended to be an easy-to-read reference on the basics of using Tableau Software, particularly Tableau Desktop. Since there are so many cool features to cover in Tableau, the series will include several different posts.

To examine the side-by-side bar chart, let’s first take three rows of vertical bar charts. These represent sales volume by state and are divided into the three different departments of our fictional company.

Vertical bar charts 

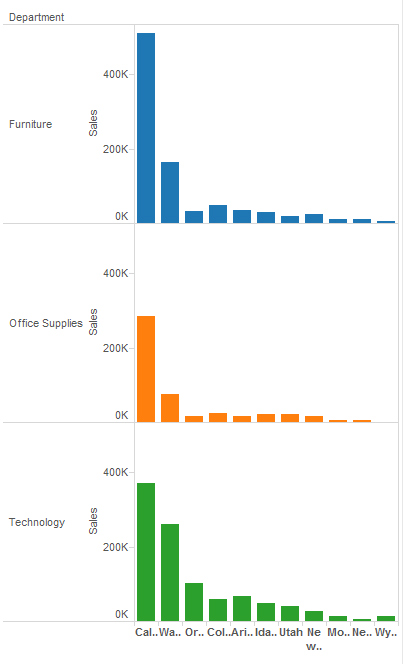
Figure 1: Vertical bar charts.

That view is useful, true, but it has two primary deficiencies. First, it limits the comparison of the state-level performance within a specific department. In other words, Technology sales performance can be compared across the different states, but it is far more difficult to compare Technology to Office Supplies.

Here’s where the side-by-side bar chart really shines. 

Side-by-side chart 

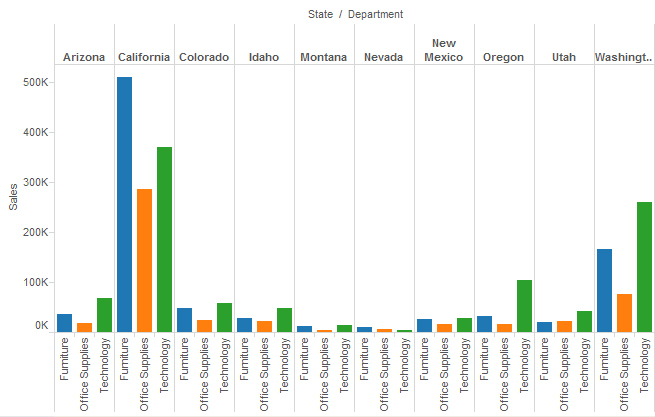
Figure 2: Side-by-side chart.

The side-by-side bar chart is a great way to compare each category in each state and department together as separate business units. Immediately, we can see that all three departments in California are the best. Perhaps surprisingly, the fourth-best performer is Washington’s Technology department.

The side-by-side bar chart is just like the stacked bar chart except we’ve un-stacked them and put the bars side by side along the horizontal axis.

You can format this chart in a lot of different ways to highlight different aspects of your data (i.e. to tell a different story). I chose to color-code all of the product categories so that if you wanted to visually scan a comparison of category to category, it would be easier.

Extra formatting

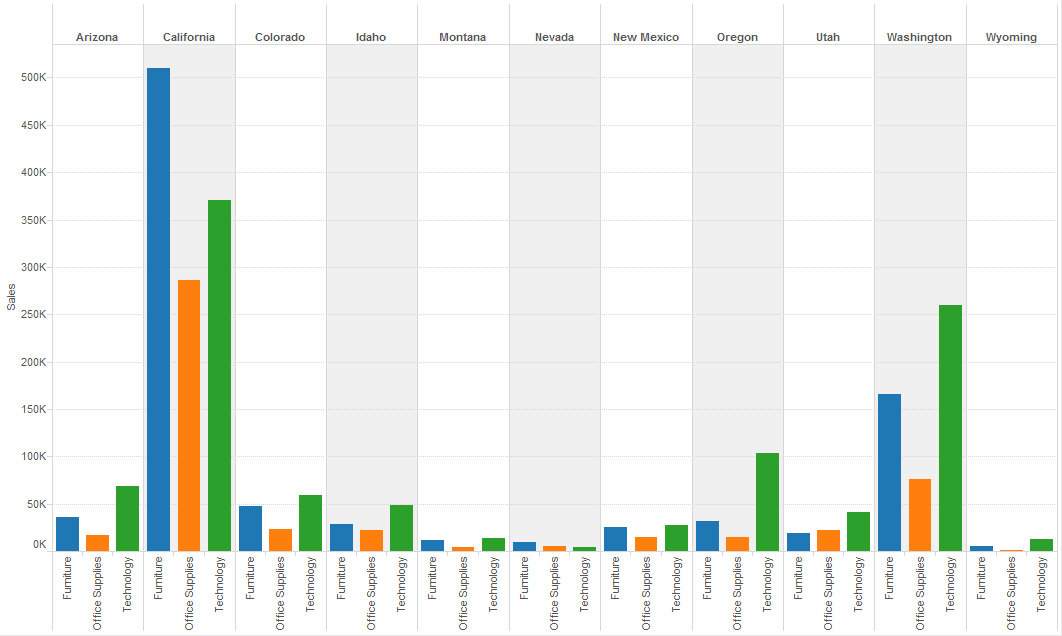
Figure 3: Some extra formatting.

To aid the report viewer in reading this chart, I added some basic formatting. First, I colored the columns in an alternating pattern with light grey to department bars by state. Then, I added a light grey dotted line for the y-axis at each $50k increment. This will help the users find the approximate value as they read across the x-axis all the way to Wyoming.

There you have it. With a side-by-side bar chart, we can easily compare individual department performance within each state as well as on the whole.

Other Chart Types

Here is the complete list of chart types from the Show Me menu. Be sure to check back often as we continue to release new articles in each chart type in this sub-series.

Introduction

  1. Text Table (Crosstab)
  2. Heat Map
  3. Highlight Table
  4. Symbol Map
  5. Filled Map
  6. Pie Chart
  7. Horizontal Bar Chart
  8. Stacked Bar Chart
  9. Side-by-Side Bar Chart
  10. Treemap
  11. Circle View
  12. Side-by-Side Circle View
  13. Line Charts (Continuous & Discrete)
  14. Dual-Line Chart (Non-Synchronized)
  15. Area Charts (Continuous & Discrete)
  16. Scatter Plot
  17. Histogram
  18. Box-and-Whisker Plot
  19. Gantt Chart
  20. Bullet Graph
  21. Packed Bubbles

More Tableau Essentials

Want to learn more about Tableau? We have several posts outlining all of Tableau’s fantastic features. Check out the full list on our Tableau Essentials blog channel.

As always, let us know if you have any questions or comments about this post or Tableau in general. If you’re looking for personalized training or help with something bigger, contact us directly!

Contact Us

Want More Tableau Essentials

  1. Tableau Essentials: Chart Types – Introduction
  2. Tableau Essentials: Chart Types – The Text Table
  3. Tableau Essentials: Chart Types – Heat Map
  4. Tableau Essentials: Chart Types – Highlight Table
  5. Tableau Essentials: Chart Types – Symbol Map
  6. Tableau Essentials: Chart Types – Filled Map
  7. Tableau Essentials: Chart Types – Pie Chart
  8. Tableau Essentials: Chart Types – Horizontal Bar Chart
  9. Tableau Essentials: Chart Types – Stacked Bar Chart
  10. Tableau Essentials: Chart Types – Side-by-Side Bar Chart
  11. Tableau Essentials: Chart Types – Treemap
  12. Tableau Essentials: Chart Types – Circle View
  13. Tableau Essentials: Chart Types – Side-by-Side Circle View
  14. Tableau Essentials: Chart Types – Line Charts (Continuous & Discrete)
  15. Tableau Essentials: Chart Types – Dual-Line Chart (Non-Synchronized)
  16. Tableau Essentials: Chart Types – Area Charts (Continuous & Discrete)
  17. Tableau Essentials: Chart Types – Scatter Plot
  18. Tableau Essentials: Chart Types – Histogram
  19. Tableau Essentials: Chart Types – Box-and-Whisker Plot
  20. Tableau Essentials: Chart Types – Gantt Chart
  21. Tableau Essentials: Chart Types – Bullet Graph
  22. Tableau Essentials: Chart Types – Packed Bubbles
  23. Tableau Essentials: Formatting Tips – Introduction
  24. Tableau Essentials: Formatting Tips – Custom Shapes
  25. Tableau Essentials: Formatting Tips – Labels
  26. Tableau Essentials: Formatting Tips – Color
  27. Tableau Essentials: Formatting Tips – Tooltips
  28. Tableau Essentials: Formatting Tips – Maps
  29. Tableau Essentials: Calculated Fields – Introduction
  30. Tableau Essentials: Calculated Fields – Logical Functions
  31. Tableau Essentials: Calculated Fields – Number Functions
  32. Tableau Essentials: Calculated Fields – Date Functions
  33. Tableau Essentials: Calculated Fields – String Functions
  34. Tableau Essentials: Calculated Fields – Type Conversion
  35. Tableau Essentials: Calculated Fields – Aggregate Functions
  36. Tableau Essentials: Calculated Fields – User Functions

More About the Author

Robert Curtis

Managing Director, APAC
Kickstarting Data Innovation in Healthcare On 13 March 2024, InterWorks was a proud Platinum sponsor of the first ever Data & Analytics in Healthcare conference, hosted by ...
Building Solutions with InterWorks at Corinium’s Data Architecture Conference in Melbourne InterWorks was a proud sponsor of the Data Architecture Conference hosted by Corinium in Melbourne on 21 and 22 June 2023. Hundreds of ...

See more from this author →

InterWorks uses cookies to allow us to better understand how the site is used. By continuing to use this site, you consent to this policy. Review Policy OK

×

Interworks GmbH
Ratinger Straße 9
40213 Düsseldorf
Germany
Geschäftsführer: Mel Stephenson

Kontaktaufnahme: markus@interworks.eu
Telefon: +49 (0)211 5408 5301

Amtsgericht Düsseldorf HRB 79752
UstldNr: DE 313 353 072

×

Love our blog? You should see our emails. Sign up for our newsletter!