
Not everyone is a Tableau guru, at least not yet. To help Tableau rookies, we’re starting from square one with the Tableau Essentials blog series. The series is intended to be an easy-to-read reference on the basics of using Tableau Software, particularly Tableau Desktop. Since there are so many cool features to cover in Tableau, the series will include several different posts.
The scatter plot, also known as a scatter diagram, scatter chart, scattergram or scatter graph, is useful to compare two different measures for patterns. Like the circle view and the side-by-side circle chart, the scatter plot also uses symbols to visualize data. The big difference with a scatter plot is that both axes in the chart are measures rather than dimensions (one measure on the Column shelf and another measure on the Row shelf).
In Figure 1 below, we’re examining the height and weight measurements from the 2014 NFL draft (Weight is on the Column shelf and Height on the Row shelf).
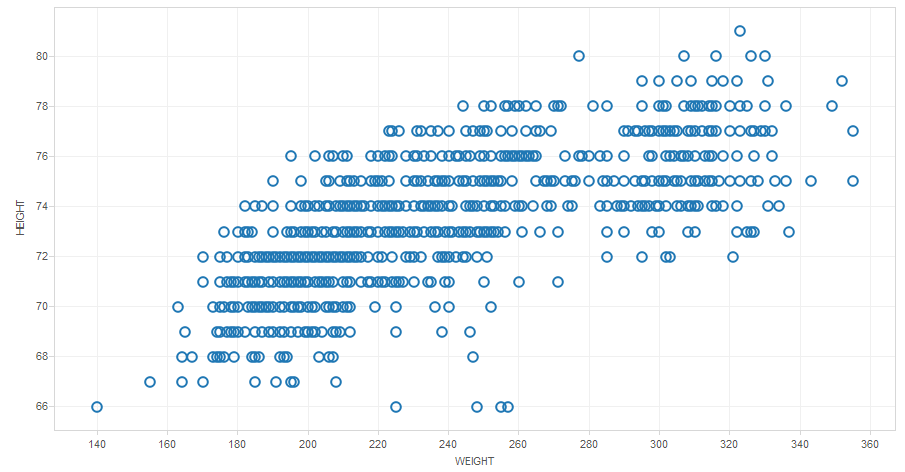
Figure 1: A basic scatter plot.
Just from a casual glance, we can see that the scatter plot seems to form two main clusters. There seems to be two different types of physical types that excel at the elite level in football. Let’s change the mark type to Shape and drop a dimension that lists positional groupings (backfield, QBs, LBs, etc.) onto the Shape shelf and see if we can identify a pattern within these two clusters. The results are shown in Figure 2 below:
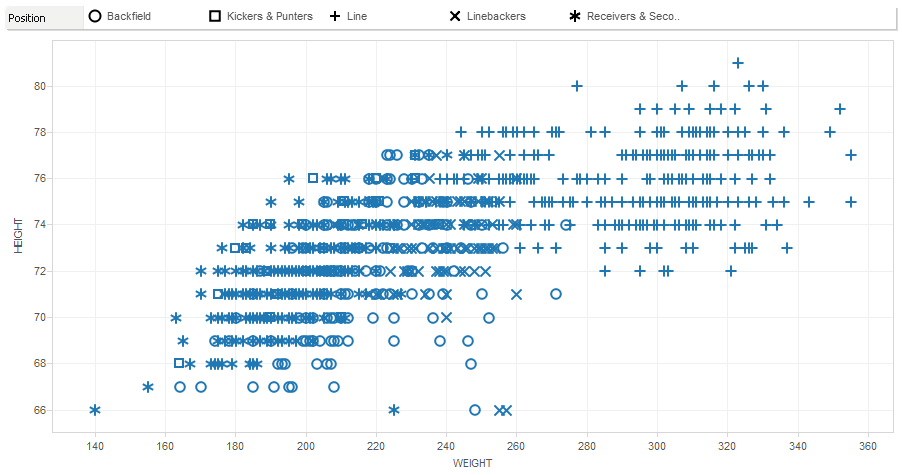
Figure 2: The scatter plot with changes.
No surprise there. The biggest players on the field are the linemen and overwhelmingly so. Bridging the gap between the offensive and defensive line to the rest of the pack are the tight ends. On the other side of the scatter plot are the speed positions, particularly the receivers, corners and safeties, mixed in among kickers and punters.
Let’s add a few finishing touches to our visualization. First, we’ll color code the marks with a BMI score adjusted for athletes by dragging and dropping the BMI score field onto theColor shelf in the marks card. We’ll edit the color legend to show anything over 30 shaded in red. Next, we’ll include a quick filter by positional group (by right-clicking on the positional group dimension and selecting Show Quick Filter) and filter out everything except Receivers & Secondary and the Linemen. Lastly, let’s add a trend line—right-click in the white space in the visualization and select Show Trend Line.
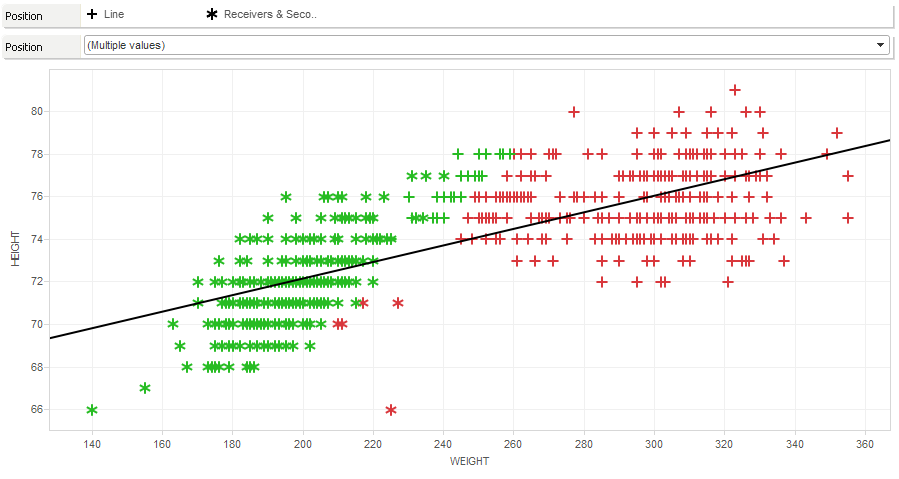
Figure 3: The scatter plot with finishing touches.
The validity of the body mass metric aside, we can see that it cuts almost right down the middle of this data set with a steep incline of weight gain for each inch in height for the typical football player.
Examining the athlete details from the NFL draft gives us a representation of the strengths of a scatter plot, using granular data points to build the impression of a pattern.
Other Chart Types
Here is the complete list of chart types from the Show Me menu. Be sure to check back often as we continue to release new articles in each chart type in this sub-series.
- Text Table (Crosstab)
- Heat Map
- Highlight Table
- Symbol Map
- Filled Map
- Pie Chart
- Horizontal Bar Chart
- Stacked Bar Chart
- Side-by-Side Bar Chart
- Treemap
- Circle View
- Side-by-Side Circle View
- Line Charts (Continuous & Discrete)
- Dual-Line Chart (Non-Synchronized)
- Area Charts (Continuous & Discrete)
- Scatter Plot
- Histogram
- Box-and-Whisker Plot
- Gantt Chart
- Bullet Graph
- Packed Bubbles
More Tableau Essentials
Want to learn more about Tableau? We have several posts outlining all of Tableau’s fantastic features. Check out the full list on our Tableau Essentials blog channel.
As always, let us know if you have any questions or comments about this post or Tableau in general. If you’re looking for personalized training or help with something bigger, contact us directly!