
Tableau Deep Dives are a loose collection of mini-series designed to give you an in-depth look into various features of Tableau Software.
In the previous article of this Deep Dive on LODs, we talked about Detail in general for Tableau Desktop. In Part 2, we’ll explore the Include level of detail calculation.
Start With the Data
Before I go into Tableau Desktop, I always think it’s foundationally important to discuss what we are trying to do in terms of the data itself. Tableau is great for doing the heavy lifting when it comes to aggregation and calculations, but it’s always up to us to perfect the logic first.
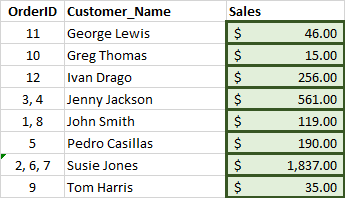
Let’s assume a very basic table with the following fields: OrderID, Customer Name and Sales. Here’s a snippet of our data, the first twelve rows:
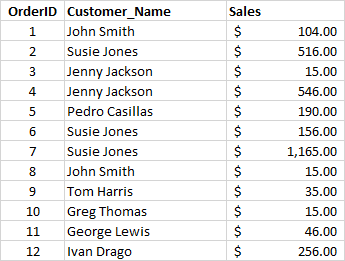
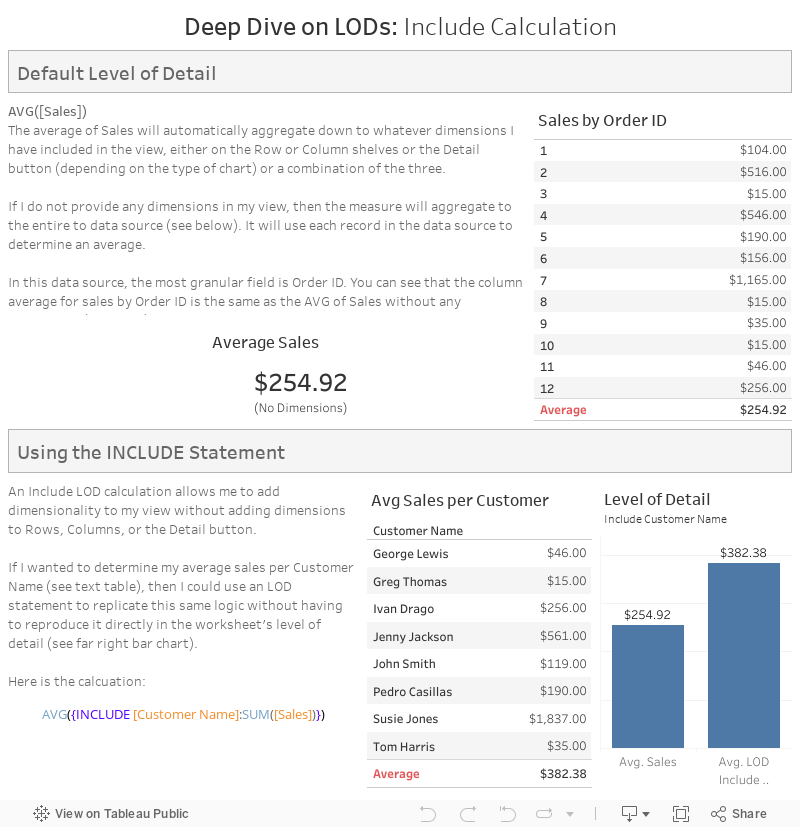
For our example, let’s make our aggregation an average. Our highest level of aggregation, and thereby the least amount of granularity, is to simply average all twelve records of our sample data set. This also corresponds to our OrderID field, which would be our primary key for this table; so OrderID is also the highest level of detail by default.
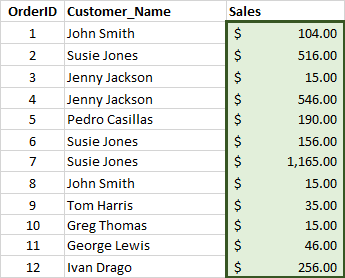
I summed the entire column and then divided it by the total number of rows, which is $3,059.00 divided by 12. The result of this aggregation would be an average sales per record of $254.92.
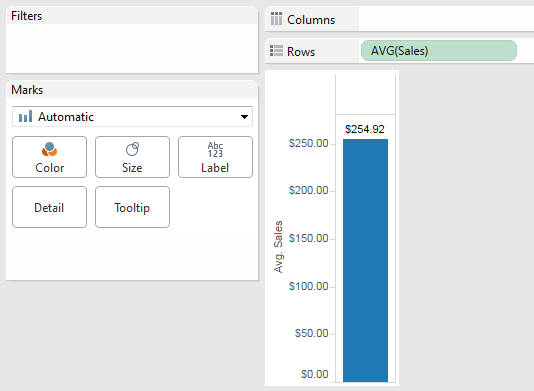
Inside of Tableau Desktop, this looks like this:
Let’s increase our level of detail by also considering the other dimension in our sample data source, Customer Name. My question that I want Tableau to answer is:
What is the average amount of sales per customer?
Let’s re-sort our table by Customer Name:
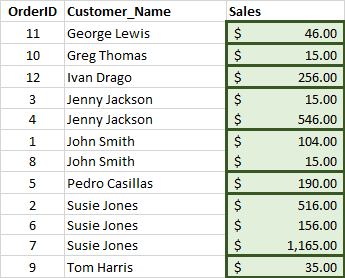
Now let’s group all of our orders by Customer Name and sum the sales by customer:
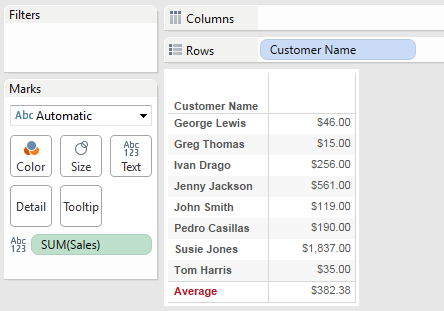
Now, we can average as we did before by summing the entire column and dividing by the new number of rows. In this case, my denominator is going to be eight customers rather than the 12 total records. The result is $382.38 per customer.
I have changed my level of detail. Prior to level of detail calculations, to derive the average sales per customer calculation would have meant including Customer Name into your visualization. I’ve reached the same number by including a Grand Total aggregated on average in this example using Customer Name as my dimension:
Let’s see how we can accomplish that same calculation inside of Tableau without adding Customer Name to the visualization.
Level of Detail Syntax
But first … let’s visit the syntax that Tableau wants for our LOD calculation. In the Calculated Field editor, Tableau Desktop color codes the different elements of your calculation. Functions are in blue. Fields are in orange. Parameters are in purple. LOD is in dark blue.
Here’s our syntax:
{INCLUDE [dim1]: aggregate expression}
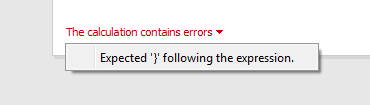
Tableau will offer to autocomplete your LOD as you are typing. It will not however, add the end bracket. Make sure to add that or you’ll get the following error message:
You can use additional dimensions within your LOD calculation by adding a comma between them, like so:
{INCLUDE [dim1], [dim2] : aggregate expression}
Include LOD
Here’s how we would reach the same level of detail for our average sales per customer example above within Tableau Desktop. First, we create a calculated field, which I’ve named LOD Sales Include Customer Name. Remember, we need to first sum our measure (Sales) on our new level of detail (Customer Name):
{INCLUDE [Customer Name]: SUM([Sales])}
Now, we can aggregate our calculated field using average when we use it in the visualization. Here’s how it looks inside of Tableau:
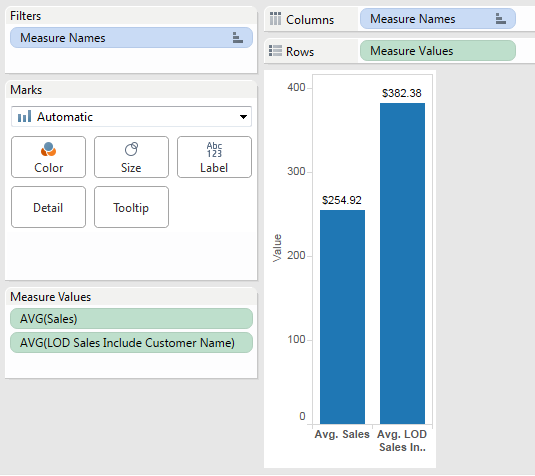
Success! The average sales across all orders is correct ($254.92) and the average sales per customer is also correct ($382.38).
Note that we haven’t used Customer Name in any of the other three areas where you would define your level of detail – Rows, Columns or Detail. We used an LOD calculation to Include customer name in the level of detail. You can see that we’ve got a much greater degree of flexibility and control in our visualizations.
The next topic we’ll cover in Part 3 is the Exclude option. Remember, leave comments or questions in the space below. Cheers!