
Tableau Deep Dives are a loose collection of mini-series designed to give you an in-depth look into various features of Tableau Software.
In Part 4 of our Tableau Deep Dive on level of detail, we’re going to examine the last of the three LOD calculation types – Fixed. Remember: This series is building upon each article, and I highly recommend that you start with Part 1 and go forward in order.
Fixed LOD Calculation
Both the Include and Exclude calculation types are relative to the visualization in which they are used. If you Include a dimension that is already in the view, then the Include calculation will have no extra effect. Likewise, if you Exclude a dimension that is not in the view, then that calculation will have no effect.
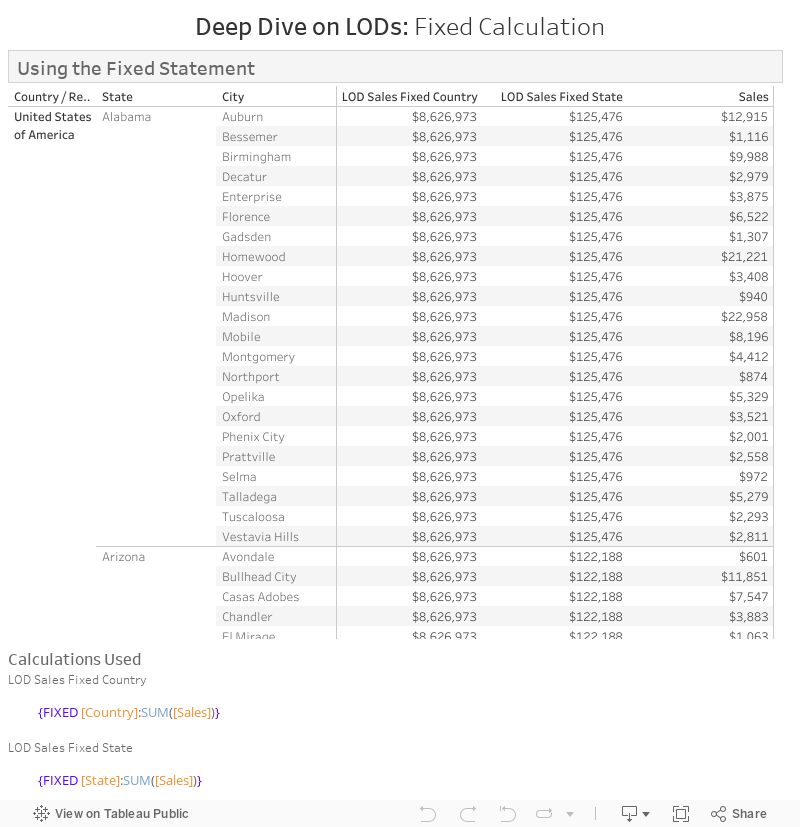
Fixed LOD calculations are not relative at all. Instead, we tell the calculation to only focus on the dimension(s) that we specify in the calculation regardless of what is and what is not in the visualization. To illustrate this example, we’ll build the same view that we had in Part 3 (Exclude):
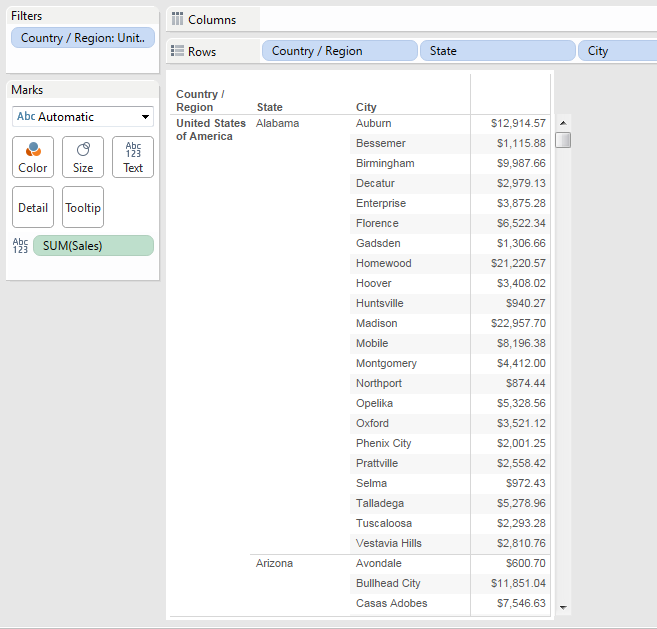
For our imaginary use case, we want to show the sum of Sales for State and for Country. We achieved this in our Exclude example, by excluding City and then City and State. The strength of the Fixed LOD calculation is that we don’t have to anticipate what dimensions are or are not in the view to accomplish the same result. We simply fix the level of detail on the dimension(s) that we want.
Here’s how the calculation for the sum of Sales for State would look, named LOD Sales Fixed State:
{FIXED [State]:SUM([Sales])}
This calculation is mimicking the following view:
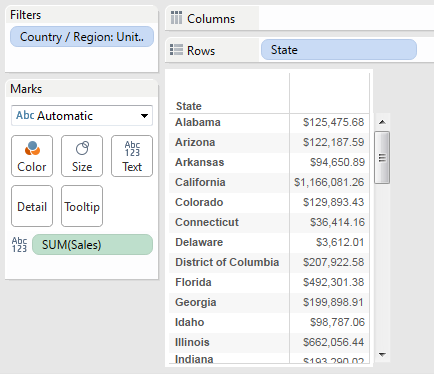
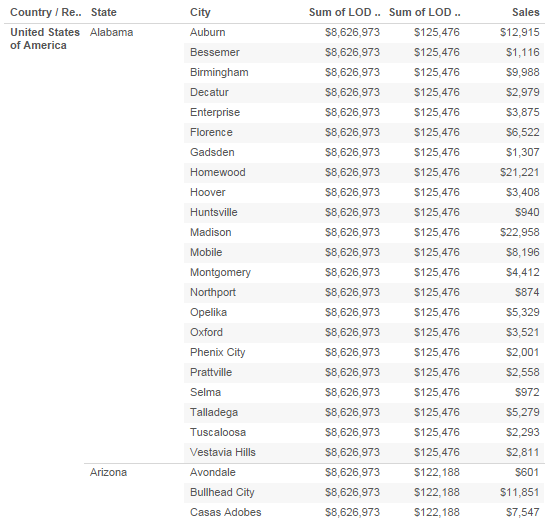
It doesn’t matter what is in the original view, we are telling Tableau to consider the State dimension only. Let’s add our LOD calculation to our view:
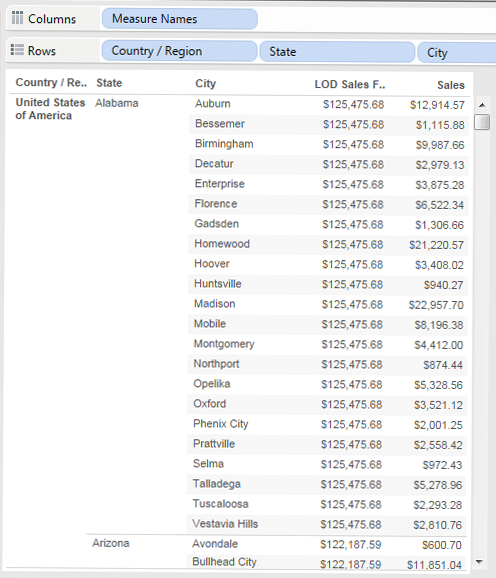
In our Exclude example, we achieved the same result as above by excluding the City dimension. The Fixed LOD calculation is more versatile and can be used across more worksheets. That’s because it is not dependent on the dimensions used in that worksheet like Include and Exclude would be. To add another column for sum of Sales by Country, we create another calculation fixed on the Country dimension:
{FIXED [Country / Region]:SUM([Sales])}
Adding it to the view gives us the following:
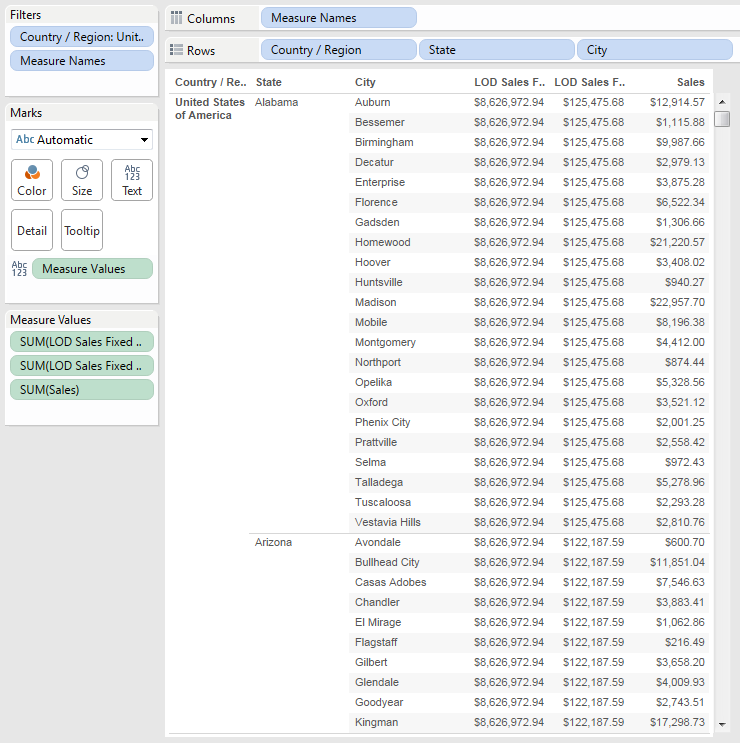
Success!
Let’s test this. If I added another dimension to my Include or Exclude examples, the numbers produced by the LOD calculation would change. For instance, if I added the Department dimension to my Exclude example, my view would go from this:
To this:
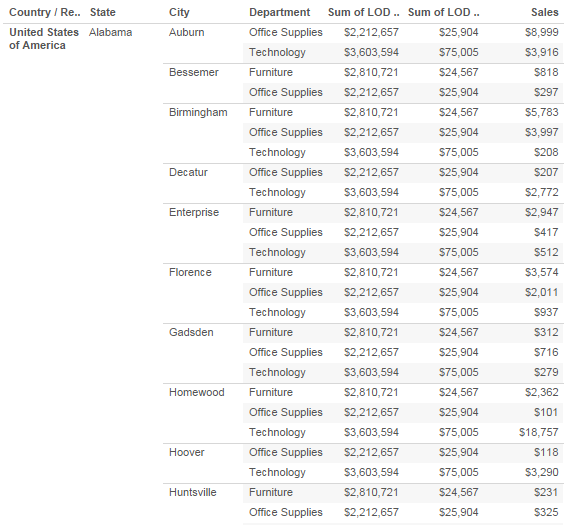
Adding Department to the view has changed all of my numbers. Just to hammer it home one more time, the Include and Exclude statements are relative to the view. What happens if I do the same with my Fixed calculations? Will they change if I add another dimension, as well?
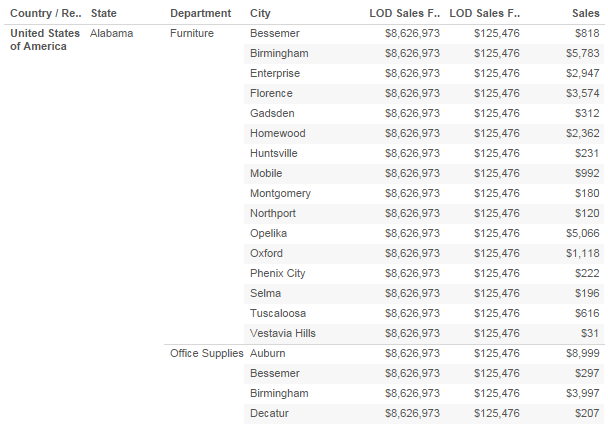
No, it has not changed the values in my LOD calculations. As you can see, they remain the same even though the Sales column has changed. That’s because our Fixed calculations are not relative to anything else in the view.
One More Wrinkle
Here’s where LOD calculations get tricky. What happens if I use a completely different dimension than what I’ve used to fix my LOD calculation? Let’s use Department again. What will happen to my LOD calculation fixed on State?
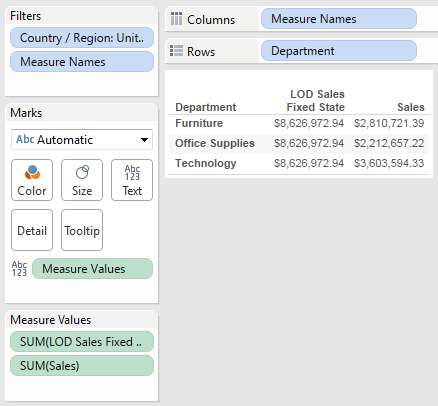
The calculation LOD Sales Fixed State is not showing State-level sales. Rather, it is showing the same value that we discovered for Country/Region-level sales. Why? Is it broken?
No, our LOD calculation is working exactly as it is supposed to. Here is where LOD gets confusing. In our view, we only have Department as our level of detail. Our LOD calc is working correctly, but we haven’t provided the level of detail in the view for it to show it. Remember, we have filtered on USA data only, so it’s aggregating everything up to appear as a sum of Country/Region. In the background, it is doing this on the State level of detail. Since our aggregation type is SUM, it’s simply adding up all of the states and producing the same result as a Country/Region total.
To better illustrate this, let’s build another view. We’ll have the sum of Sales by State with a Grand Total aggregated by average:
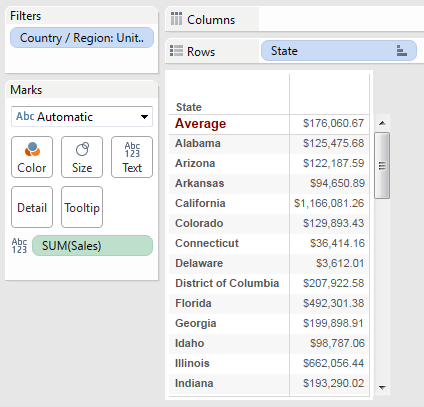
This view shows the sum of Sales for each state and then the average sales across all states, which comes to $176,060.67.
Remember our view that only had the Department dimension listed? We’ll change the aggregation type on each measure to an average rather than sum, and now you’ll be able to see the LOD calculation at work:
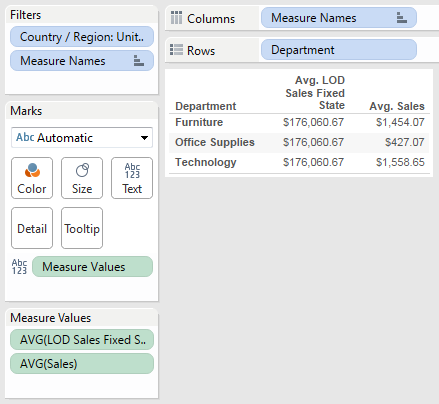
Here’s how we know that our LOD calculation is working. The average sales by Department is averaged across every record in each of the three departments. That’s why those values are so small in comparison, because it’s averaging each order within those departments. The LOD Sales Fixed State calculation is looking at the sales per state level rather than on the record level. We get the same value that we had in our average across the sum of all states from the previous table. These LOD values are all the same down the column, because we have not considered the Department dimension because are fixed solely on State.
If I changed my Fixed LOD calculation to an Include calculation that included State, it would consider the sum of Sales per state but segmented by Department as well:
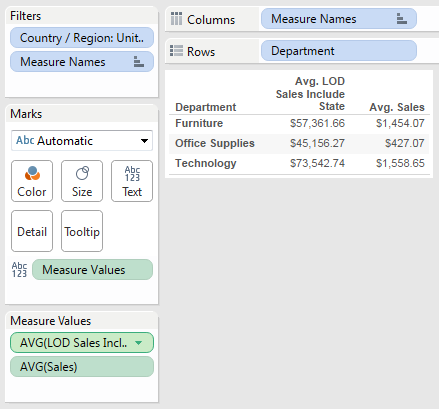
Presto!
In our last article within our Tableau Deep Dive on LOD (Part 5), I’ll explore the difference between LOD calculations and table calculations. As always, we love to hear your comments, questions and thoughts in the space provided below. Cheers!