
Tableau Deep Dives are a loose collection of mini-series designed to give you an in-depth look into various features of Tableau Software.
We are now ready to start building a proof of concept or POC of our dashboard. Think of a POC as a prototype or your Beta test. We are focused on dashboard design, so I won’t spend much time on the actual construction of individual worksheets. Instead, let’s focus on bringing them together into a single reporting tool, a dashboard.
As before, we’ll introduce some theory and then apply it in the Practicum section in the second half of the article.
Concepts
Early Considerations
This last point is a catch-all for considerations that you should check off early, before you start building. First, I recommended in Layout & Structure that you stick to fixed sizing. I’m going to add to that by suggesting that you find the size (height & width) of your dashboard before you start building. When you resize your dashboard, whether tiled or floating, all of the dashboard objects resize proportionally. It’s much easier to lock in a size first and then work within those constraints.
As a recommendation of size, you have to understand where and how your users will access your dashboard. Do they use a desktop or laptop? Phone? Tablet? The good news is that you can seamlessly accommodate specific devices using Tableau’s Device Preview option in your dashboard screen.
Most organizations have some type of analytics package on their internal network – whether it is Google Analytics, Web Trends, etc. Within those tracking tools, there is a breakdown of the visitor’s screen resolution. You can find out what percentage of users have different bins of screen size. Plan your dashboard size to accommodate as many users as possible and then accommodate the smaller bins using the Device Preview feature.
Rapid Prototyping
Tableau has formulated a plan or process to grow from a single Tableau evangelist to a full enterprise level deployment complete with a Center of Excellence. This methodology is known as Tableau Drive. One component of Tableau Drive is how they recommend you approach dashboard creation.
Traditional software design relied on the Waterfall Method, which had distinct, sequential steps: requirements, design, implementation, user acceptance testing and finally deployment. Unfortunately, stakeholders are only involved at the very beginning and at the very end of that process. It puts the software developers into a black box and the resulting application or tool often doesn’t match what the stakeholders need or want.
Rapid prototyping takes that same cycle and puts it into a series of sprints that repeat over and over again until the project is done. The end user is brought in for requirements and guidance. The developer then produces a rough prototype in a short period of time (perhaps even a few hours), then shares the results. This continues until the prototype is as close to perfect as possible.
A couple of big advantages in approaching dashboards like this:
- The stakeholder has input throughout the entire process to ensure the tool meets the goal.
- User adoption will be much easier with stakeholder evangelism.
- The stakeholder will learn Tableau’s capabilities in the process, which will enrich their ideas for the dashboard.
- Any data deficiencies will be highlighted for correction or collection.
Practicum
Pre-Dashboarding Work
My first step would be to pull the internal web user data for our hypothetical company out of Google Analytics to suggest an optimal size, if your Tableau CoE doesn’t already have a recommendation. Alternately, I could go to my internal Tableau CoE for a suggestion on dashboard size in accordance with their best practices.
Here’s what the Google Analytics output might look like:
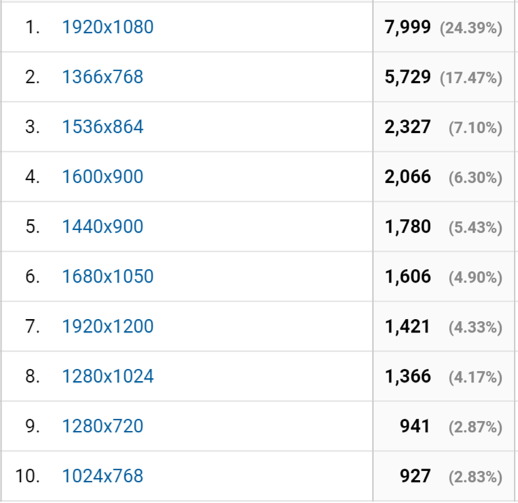
Looking at our data above, we can capture nearly 83% of all intranet users by making our dashboard a width of 1000 pixels or less. We can use the Device Preview to create alternate sizes to cover tablet, and mobile phone to cover the rest.
Constructing the Layout
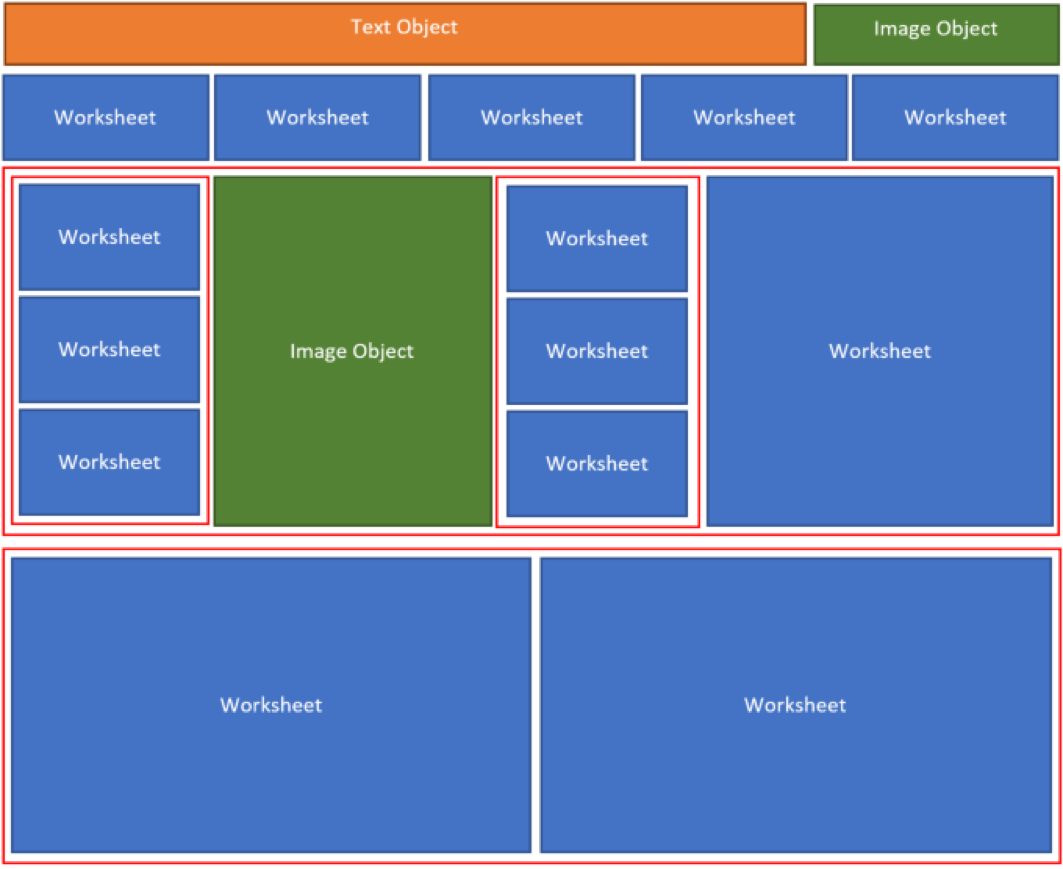
Based on our layout diagram from the previous article, I’m going to stick with a mainly tiled approach. There are a few elements that will be floating, but they’ll be the exceptions. Also, remember the importance of that left margin. I’m going to put my beautiful marketing funnel on that side, just beneath the dashboard logo and some key metrics.
For my design, I’ll use containers sparingly. Most of what I’m trying to do can be accomplished with the worksheet chart directly. I’ll group similar worksheets into an appropriate format and then set their size to fit “Entire View.” My worksheets below are in BLUE. My images are GREEN. My text object is in ORANGE and my containers are in RED. Note that I’m using horizontal as the main containers with two vertical containers to accommodate my two stacks of worksheets.
Let’s take that layout and insert our worksheets, images and blank objects onto our dashboard. Here is our rough draft dashboard:
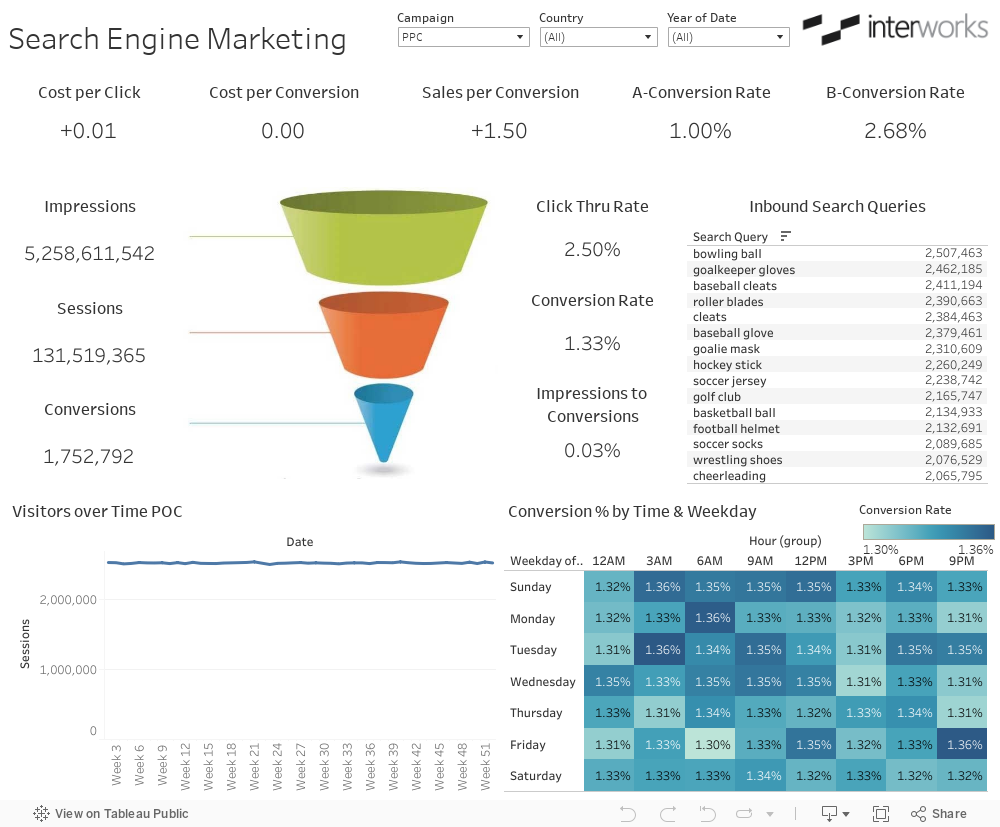
Everything is functional and everything is on the dashboard in the right layout. Perhaps most importantly, we have verified that our data, our logic and our assumptions are all accurate. This is the prototype that we are working towards in short sprints. That was the goal for our proof of concept (POC).
What’s Next?
In our next Deep Dive article on Dashboard Design, we’ll explore how we add Interactivity to make our report go from a static picture to a reporting tool. We’ll follow that with visual best practices, optimization and publishing. Until then, put any thoughts and questions in the comments section below.
Cheers!