
Tableau Deep Dives are a loose collection of mini-series designed to give you an in-depth look into various features of Tableau Software.
Dates are one of the most confusing topics that come out of Tableau training. What is the difference between a continuous date and a discrete date? What is the difference between those and normal continuous and discrete fields? Why isn’t my date field showing up in Tableau Desktop with the appropriate data type? What are date parts? Custom dates? I hope to explain all of that and more in a new Deep Dive series exclusively on Dates.
Here’s our article schedule:
- Part 1: Introduction to Dates
- Part 2: Preparing Dates
- Part 3: More Date Functions
- Part 4: Using Exact Dates
- Part 5: Custom Dates
- Part 6: Rolling Dates
- Part 7: Creating A Calendar Chart
- Part 8: Week-by-Week Comparison
Let’s start with a quick introduction to dates and the date data type.
Quick Introduction
Dates are dimensions and they will always appear in the Dimensions section of your data pane. Remember, being a dimension does not always mean that they are discrete. In fact, they can be either, but more on that in the next section.
They can come in two different data types within Tableau –  date and
  date & time. Unlike most other data types, these two different types of dates can work interchangeable together. If you mix a date data type and a date and time data type, then Tableau will assume that the time element of the date only field is simply 12:00:00 AM for the purposes of any calculations.
Some chart types are at their best when utilizing a date field, such as a line graph or area graph. Also, some table calculations require a date field, such as YTD Growth or YTD Total.
Discrete vs. Continuous
Date fields, as I mentioned above, can be either discrete or continuous. To understand the difference, let’s first talk about date parts and date values. Discrete dates use date parts. Date parts are literally the parts that make up a date. Let’s take the date of March 6, 2016. The “month” date part is March (or 03). The “day” date part is 6 and the “year” date part is 2016. If I used any of these on their own, such as month, then I would be looking at every March aggregated together in my view and so on.
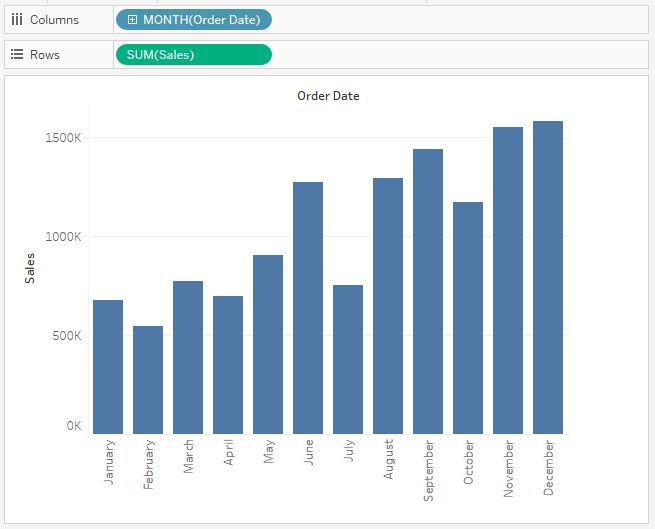
Notice that my Order Date field on Columns is 1) in blue denoting that it is a discrete field and 2) is set the date part of “month.” In the view, I only see that particular date part on my headers. If my data set includes data from 2012 to 2017, then all of those Januaries would be aggregated into that discrete column for January.
Date values are used for continuous dates. They follow the same structure of date parts (i.e. year, quarter, month, week, day and so on). The difference between date values and date parts is that date values imply a level of detail in a timeline. Remember continuous fields do not create headers, they create an axis. In the case of a continuous date, it creates a timeline. Date values determine how our timeline is organized.
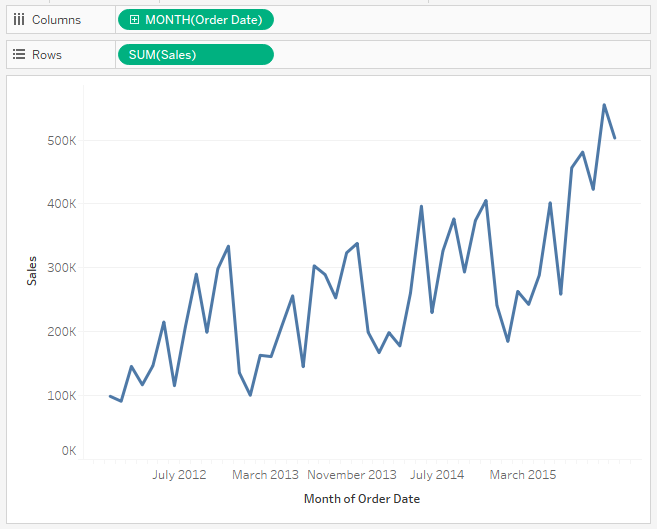
In the chart above, notice that our Order Date on Columns is 1) green which denotes a continuous field and 2) is set to the date value of “month.” That means in our view we are segregating our data down to the date level on our timeline. Rather than looking at all Januaries aggregated together, we are looking at a specific January such as January 2012 or January 2013.
Each date field in the column shelf on both examples as a + sign in front of it. They operate differently for discrete and continuous. For discrete dates, that plus sign expands the hierarchy of date parts. Expanding the hierarchy in our example with “month” would add a new field to the view:

For a continuous date, clicking on the plus will change the date value down to the next lowest level. It will not expand like a hierarchy. In the above example for continuous dates, it will expand down to “week.”
Finally, to choose a discrete or continuous date, simply right-click on the date field. You will get the following menu option:
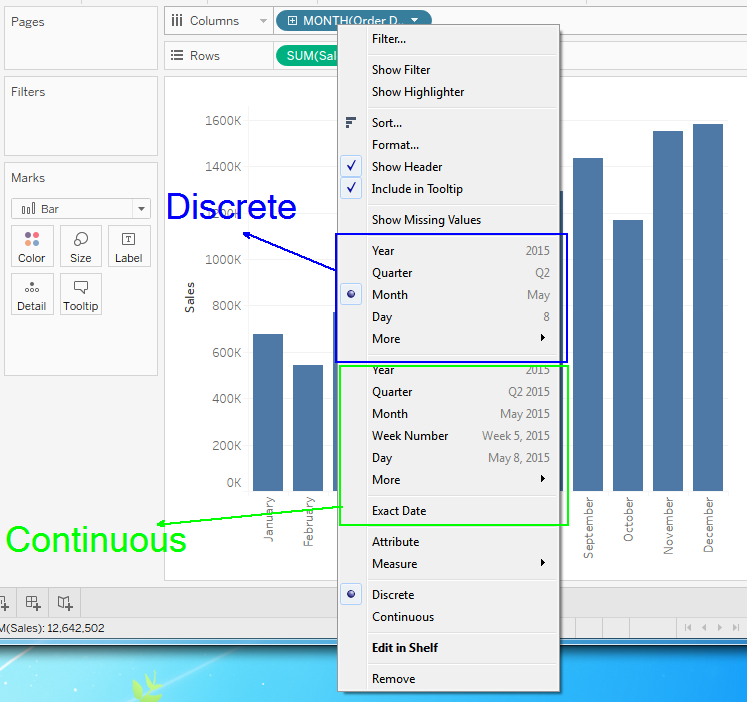
The top selection of dates is discrete and you can tell by the example data provided next to each. The bottom group of dates are continuous.
A quick word of warning: Do not use the Discrete and Continuous options at the bottom of this menu to switch back and forth between a discrete date and a continuous date. It is not the same functionality and will work differently.
Default Properties
Dates have some unique options when it comes to their default properties. We’re going to specifically examine two of those properties. The first is date formatting and the second is fiscal year start.
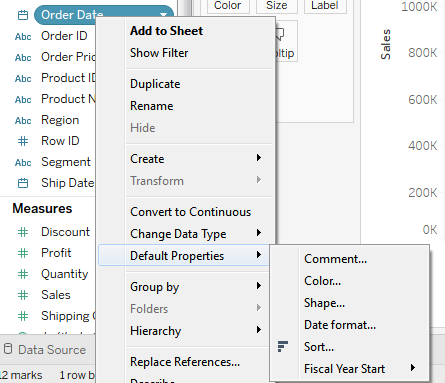
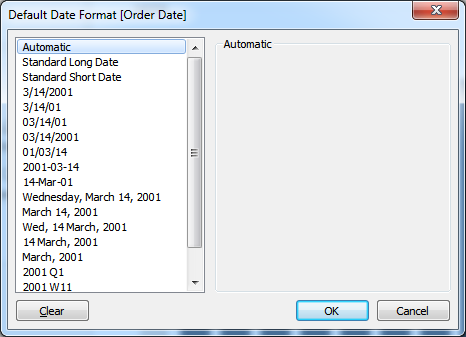
Date format allows you select how your date will be presented similar in effect to number formatting:
Fiscal year start allows you to change the start of your year for fiscal year analysis. For instance, in Australia, where I live, our fiscal year starts on July 1st. If you intend to also use your date field for analysis on the calendar year, my suggestion is to create a copy of your date field to serve as your fiscal year field.
Basic Date Functions
To conclude this introduction to dates, we’ll introduce two functions that tie back to our discussion on date parts.
DATEPART(): The DATEPART function returns the specified date part as an integer. For the date March 6, 2016, the calculation will look like this:
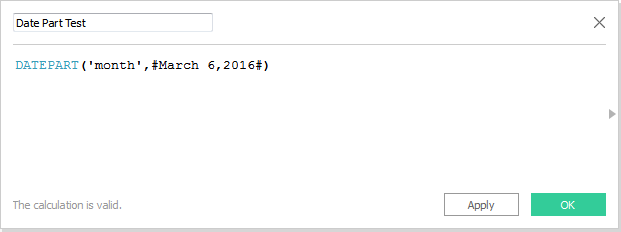
The result will be a 3 as March is the third month of the year.
YEAR(), MONTH(), DAY(): These functions are very similar to the DATEPART function, except the function directly specifies the date part you’re looking to convert to an integer.
Here’s how you can use these functions in the real world. Let’s say you want to grab only your 2013 sales. Use the following formula to achieve that result:
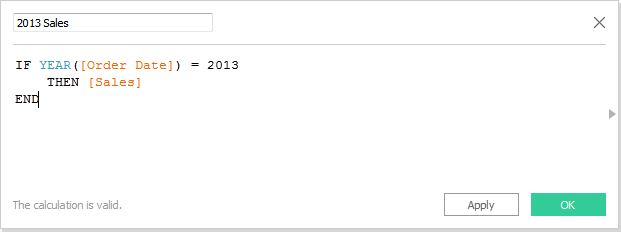
Remember, do not add SUM to sales in the calculation above. All of the date functions that we talked about above do not count as aggregation. Adding SUM to sales will give you an error because of the mismatched aggregation levels.
What’s Next?
In article #2 of our Deep Dive on dates, we’ll explore how to work with dates. Specifically, we’ll explore the DATEPARSE() and DATENAME() function. Until then, let me know if you have any thoughts or questions in the comments section below. Cheers!